
Greece warned over potential ‘mass exodus’ of shipping companies

Indeed, Greece will need to work hard if Piraeus is to retain or strengthen its standing as a maritime capital, with an alarming one in two Greek shipping companies ready to consider relocating their administrative bases abroad.
According to the findings of the study “Repositioning Greece as a Global Maritime Capital” conducted by multinational professional services firm, EY, some 56\% of responding companies to the study would consider repositioning as the European Commission’s Directorate-General for Competition is causing uncertainty for the Greek shipping industry with its prolonged examination of its legal framework.
Indeed, EY reports some echoing sentiment of the Union of Greek Shipowners (UGS) that “a major exodus by Greek-owned shipping companies is possible”. The UGS has warned the prevailing uncertainty is threatening Greek shipping, which makes up half of Europe’s industry.
The EY study and UGS statements underline the prospect of relocations by shipping firms to new bases offering more favorable conditions – beyond Europe, or even within Europe, to non-EU countries – can no longer be ruled out.
Taxation and the regulatory framework are the main concerns with 84\% of respondents in the EY survey referring to taxation and 64\% to the regulatory framework as the main reasons that would prompt them to seek new bases. Singapore, London and Dubai ranked as the most popular alternative destinations with Cyprus also emerging as a nearby, competitive maritime cluster. All have actively been touting Greek business.
The EY study shed light on the industry’s perceptions of the competitive advantages and disadvantages of Greece as a basis for shipmanagement functions, the attractiveness of competitive maritime centers and the ways in which the competitiveness of the Greek maritime cluster could be improved.
Perceived advantages and disadvantages of the Greek flag are also examined. EY says: "The survey revealed human capital, the seamanship, along with geographic location and, obviously, ship-ownership, are the main competitive advantages of Greece as a ship-management center, while the lack of a stable regulatory environment governing the cluster, lack of access to financial institutions, poor infrastructures and tax issues are the main disadvantages.
However, EY says that "in spite of the perceived disadvantages of Piraeus and the growing attractiveness of competing maritime centers, the Greek shipping community remains confident about the role of Greece as a maritime center in the coming years and believes its enhancement would strengthen their business”.
EY says Maritime UK, a non-profit organisation which brings together the UK’s shipping, ports, marine and business services sectors to promote the UK as a world-class maritime center, could be a useful model for a similar Greek association.
Indeed, the benefits of continuing to foster the strong long-standing relationship between Britain and Greece, and in particular their shipping industries after Brexit, were emphasised by the ministers of shipping of each country, within the context of the 4th Greek-British Shipping Forum held in Athens, in July.
"Traditional ties between our two people will continue," Greece's Shipping and Island Policy minister, Panagiotis Kouroumplis said, adding "this cooperation in the field of shipping can have concrete and beneficial results for both".
But as EY noted, for the time being, Greece continues to find itself among the maritime capitals offering attractive environments for shipping companies, but the future is uncertain, sector pundits underlined, citing the fears felt over legal, regulatory and tax terms as primary concerns.
source: Seatrade (UBM (UK) Ltd).
David Glass
Greece Correspondent, Seatrade Maritime
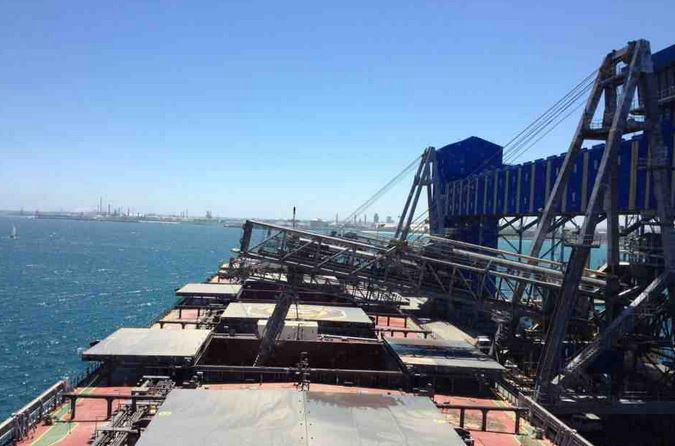
DRY BULK SHIPPING: Strong demand improves market as it exceeds high fleet growth
Demand
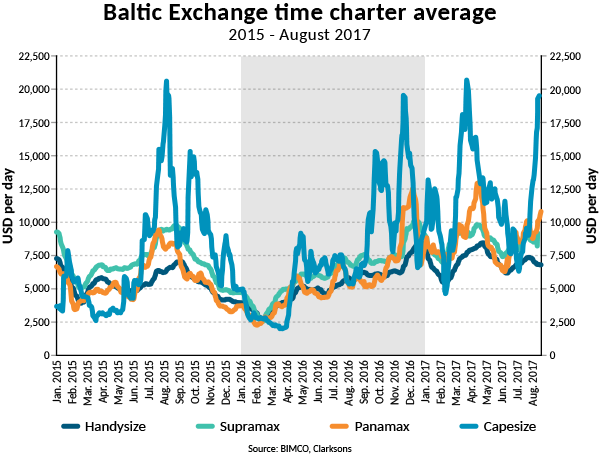
Since early July, the capesize rates have gone up and up. By mid-August, they had reached a breakeven level to become profitable. BIMCO estimates that a capesize ship on average fleet financing and operational cost levels, turns profitable when rates are above $15,300 per day.
But the improvements are unfortunately not seen in any of the other segments. This reflects the development in cargo demand, and highlights the fact that overcapacity remains a challenge.
Iron ore and coal volume growth have both been very high, driven by China. Domestic steel mill margins have risen throughout the first half of the year, ensuring that steel mills are keen to keep up production, and higher steel production means a healthy demand for coking coal too. This happens even with lower steel exports out of China, which is hampered by trade restrictions set up by importers.
For thermal coal imports into China, it is important to watch hydropower electricity production. Hydropower electricity production has been falling on a year-on-year basis every month since December 2016 (source: Commodore Research), due to lower levels of rainfall.
As Chinese electricity demand this year is higher than ever, coal-fired power-plants are bridging the gap. This benefits dry bulk shipping, but watch out for coal prices delivered in northern parts of China. If they go high (above 630 yuan per ton), the authorities tend to intervene and increase domestic production. A pick up in hydropower production would influence demand for thermal coal imports negatively.
As BIMCO reported on 9 August, China has sourced coal all the way from the US East Coast, with a sailing time of 45 days. This adds a lot of tonne-miles to panamax and capesize demand.
Demand for thermal coal has grown solidly across Asia, with Taiwan and South Korea leading the pack. The only exception is India which is using more and more domestically mined thermal coal, importing less for the third year in a row.
Beyond coal and iron ore, demand growth has been seen across the board. Soybeans set a quarterly all-time high for Q2 and grains are expected to have a strong Q3. (source: SSY)
Supply
With improving shipping markets comes faster deliveries of ships from global shipyards. BIMCO sees this in all the main shipping segments that we analyse.
This is to put it simply, how participants in the shipping industry and associated industries react, and is the reason why BIMCO reiterates the view that market recovery will be slower than many would hope. This is because improved demand is always followed by reduced focus on handling the supply side challenges. This means less idling and demolition as well as shorter/fewer postponements of deliveries.
BIMCO expects 40m DWT to be delivered in 2017, offset by 19m DWT of demolished capacity. Year-to-date, 30m DWT has been supplied while 9m DWT has left the fleet. We know that a higher BDI often means less demolition, but as the BDI has been lifted solely by the capesizes in recent months, our estimates for supply side changes remain unaltered. The fleet is estimated to grow by 2.7\%.

Should demolition fall short by 5m DWT, fleet growth will jump to 3.4\%. For the recovery to stay on track, the supply side must be handled extremely carefully as the demand growth is expected to be around 3.5\%.
The supply side is made up of three elements: deliveries, demolition and newbuild orders. Thus, with faster deliveries and slower demolitions, it is worrying to note that, what we expected to happen in relation to new orders is now taking place too.
Orders for 9.6m DWT have been placed, with panamax being the popular choice. In the wake of hectic activity in the sales and purchase market during the first four months of the year, second-hand prices went up and back in sync with newbuild prices. This made the ordering of newbuild an attractive alternative again, with April, May and June being particularly busy in this respect. Still, the order book currently stands at 60.4m DWT, which is the lowest in 13 years.

The growth of the dry bulk fleet differs significantly in level and pace from handysize to capesize. Handysize fleet growth over the past year has been fairly steady at 2.1\%. It has remained constant for handymax/supramax too but at a level of 5.3\%. In between, both the panamax and capesize segments have grown at an increasing pace and to higher levels since their recent low-points in 2016.
The monthly year-on-year fleet growth rate for panamax went from -0.4\% in October 2016 to 3.1\% in July 2017. From January 2015 to January 2016, the capesize fleet became marginally smaller. The first fleet size contraction since 1998/99. Since then 59 capesizes have been delivered, lifting year-on-year growth rates in July 2017 to 3.9\%.
Outlook
In addition to the Chinese import ban on coal from North Korea - established earlier in the year in accordance with UN sanctions on North Korea in response to its nuclear and missile activities - China has also banned imports of iron ore. Seaborne shipping has seen no effect from the earlier ban, as China has not bought anthracite coal from any other suppliers. As the amount of iron ore imported from North Korea is only a fraction of coal imports, this will not be felt in the market either.
It is comforting that the demand growth this year has been broad, in terms of commodities and importing nations. Nevertheless, China is still the importer that matters but China is changing. Difficult to see if you only watch the dry bulk market, but several macroeconomic indicators point towards developments that may result in lower investments. Amongst them are Fixed Asset Investments (FAI), such as machinery, infrastructure and housing projects, which are huge drivers of dry bulk imports. Data points to lower and lower growth rates for both public and private investments. It remains to be seen to what extent the Belt and Road Initiative will counter this development positively.
For decades China has been an all-out growth story. But could China stall again, with potentially severe consequences for the dry bulk industry? Not long ago, China cut its import levels compared to a year earlier, for four quarters in a row, from Q3-2014 to Q2-2015. The result was a drop in BDI from 1,500 to 500 from early November to late February. Going forward, we must be aware that it could happen again.
Note that, BIMCO’s “Road to Recovery” will see its third update in September, providing expert analysis for the industry on the latest developments in demand and supply.
source:bimco.org
Aegean Marine Petroleum Inc. and Freepoint Commodities LLC Announce New Cooperation Agreement
Under terms of the agreement, Aegean will market bunker fuels and marine gas oil supplied by Freepoint to customers calling on the Limetree Bay Facility. The agreement calls for future expansion in the region that could lead to adding delivery capability through Aegean’s owned fleet.
Manolis Chochlakis, Aegean’s Regional Manager of the Americas, said, “We are pleased to announce the launch of our new service center in St. Croix USVI, which strengthens our existing presence in the Caribbean and represents another important step in our effort to broaden our global footprint in attractive markets. The growth and activity level at Limetree Bay has been remarkable since the terminal was purchased in 2016.”
Mr. Chochlakis concluded, “We believe working together with Freepoint, which is an equity partner in the Limetree Bay facility, provides us both with incentives to jointly grow our presence in the region. The Aegean and Freepoint teams are experienced groups that have worked well together in the past. They will ensure our customers in the Caribbean get first class service.”
“Freepoint is excited about developing this business — we envision it will be a core strategy in our global oil platform. The St. Croix Limetree Bay Facility has brought a lot of promise to the region and continues to grow at an impressive rate. We are fortunate to have the opportunity to develop a strong base of operations on the island and believe this new venture is a perfect complement to our existing business,” said Rob Peck, Senior Managing Director, Global Oil. “We have worked with Aegean for a number of years and are privileged to be cooperating with a company that is so well-respected in the industry. We believe this agreement will be extremely beneficial to both companies as we expand and optimize our business in the Caribbean. ”
The agreement begins in September and expects to be fully operational contributing results during the fourth quarter of 2017.
About Aegean Marine Petroleum Network Inc.
Aegean Marine Petroleum Network Inc. is an international marine fuel logistics company that markets and physically supplies refined marine fuel and lubricants to ships in port and at sea. The Company procures product from various sources (such as refineries, oil producers, and traders) and resells it to a diverse group of customers across all major commercial shipping sectors and leading cruise lines.
Source: Aegean Marine Petroleum Network
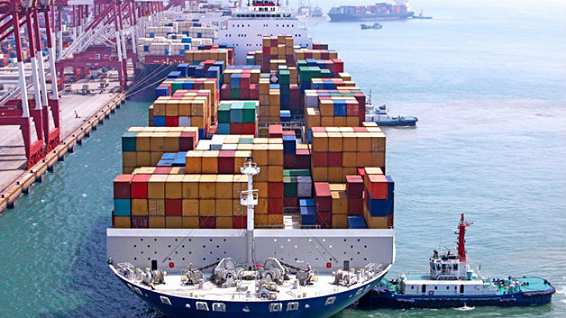
CONTAINER SHIPPING: Solid demand growth reduces spot rate volatility
Demand
As freight rates are coming back from the abyss, their actual rise seems to be magnified beyond their actual performance. Some container spot freight rates are up more than 100\% from the very low levels of last year, but may still be at a loss-making level now and so spot rates are not the best indicator for market profitability.
The broad-scoped China Containerized Freight Index (CCFI) offers a solid and alternative indication. The CCFI composite hit an all-time low at 632.36 on 29 April 2016. By 11 August 2017, it was back at 856.5 and now comparing year-to-date growth, the CCFI is up by 20.7\% versus the same period last year.
By contrast, the spot rates from Shanghai into Northern Europe are up 64\% year-to-date, year-on-year. The spot rates for containers bound for the US have gone up by 45-50\% over the same period.
It’s not only freight rates which have risen this year. Charter rates left the doldrums and went up sharply in the first four months of 2017, only to slide back down, but during June/July most of the slide had been regained.

The extreme volatility of previous years has been reduced for spot rates on the Shanghai-Northern Europe trade lane. A sign of improving demand and better market conditions since Q4-2016.
The improved freight rates come on the back of strong demand growth during the first half of 2017. Combined with steady fleet growth of 1.8\% the fundamental balance has improved noticeably. Global container shipping demand grew by 5\% in H1 2017, over the same period last year (source: CTS).
On both the key long front haul trades out of the Far East into Europe and North America, demand grew rapidly by 5.2\% and 10.0\% respectively (source: CTS). BIMCO’s own data on inbound loaded containers to the US West Coast went up by 5.4\% and to the East Coast by 10.6\%. The fastest growing import ports on the East Coast were Houston (+26\%) and Savannah (+13\%). While the main port - Port of New York and New Jersey (PANYNJ) grew by only 5.5\%, due to very weak imports in February and March.
Growth on the head haul trades is vital, as it pushes utilisation higher where it’s most needed, avoiding blank sailings and filling the ships to a larger extent than in recent years. Head haul trades deliver the higher freight rates, whereas back hauls merely reduce the costs of repositioning the ship.
Moving forward, PANYNJ, should benefit from the early completion of the Bayonne Bridge navigational clearance project. With the new air draft of 215 feet (65.5m), ships up to 18,000 TEU will now be able to reach the terminal ‘behind’ the bridge (9,800 TEU was the maximum before the elevation). This will prompt carriers to optimise their networks once again, as most US East Coast ports have upgraded their terminals in recent years to accommodate the Ultra Large Containerships.
2017 is following the trend seen in 2011-2012 and 2014-2015, of US importers increasingly directing cargo towards the US East Coast ports.
As of 7 August, 182 ships (474,000 TEU) were idled (source: Alphaliner). As the idle fleet hasn’t changed much over the previous three months, demand growth has lifted rates instead of reactivating the unemployed ships. This is one of the reasons for the improved conditions – the careful handling of supply.
Supply
The significant slowdown in demolition comes as no surprise. The magnitude, however is still striking. Remember that a lot of container shipping companies are still losing money daily. But the simple fact that rates have climbed and managed to stay up, means owners shy away from scrapping their ships.
June saw only seven small units sold for demolition (9,639 TEU in total), in comparison to the all-time high level in January where 99,899 TEU (29 units) left the fleet. This is a drop of 90\%.
BIMCO forecast a full year demolition of 450,000 TEU, out of which 306,824 TEU had already been demolished by mid-August. This is in line with our forecast that sees the second half of the year with continued fleet growth, low demolition activity and a slower demand growth than was seen in the first half.
The final four and a half months will see more Ultra Large Container capacity being launched. The scheduled order book shows 31 units with a capacity higher than 10,000 TEU, out of which 11 are larger than 20,000 TEU. BIMCO estimates that up to 25 of these ships will be delivered.
Fortunately, we still see almost no new orders being placed. Less than 400,000 TEU, have been contracted since December 2015. This is extraordinary. In comparison, July 2015 alone, saw orders for 435,268 TEU placed (50 contracts). In the same period, the orderbook has come down from 4m TEU to 2.6m TEU. The lowest TEU-level since 2003.

BIMCO expects that this low level will be difficult to maintain, as optimism in the market combined with hungry shipyards and shipping companies being eager to be top dog is a toxic cocktail.
One year ago, the container shipping fleet surpassed the 20m TEU mark, only to increase demolition and bring it back below this figure. Now we are back above the 20m TEU mark again, this time for good. The fleet now holds capacity of 20,356,656 TEU. Year-to-date, the fleet has grown by 1.8\% and BIMCO forecasts that the rate will hit 3.3\% for the full year.

665,850 TEU of the new capacity is now active and some 450,000 TEU will be delivered during the remainder of the year. 41 ships with an average size of 14,223 TEU constitute 88\% of additional tonnage, ranging from 9,400 TEU to 21,413 TEU. The latter is the OOCL Hong Kong, which will be joined by four sisters from Samsung HI later this year.
Deliveries scheduled for 2018 are equally biased toward the larger sizes, as the upscaling of network capacity and hunt for lower unit costs continues. Currently 77 ships with a capacity of 9,400 TEU and an average size of 15,578 TEU will amount to 82\% of the new influx. However, it is anticipated that postponements and delays are likely to impact this schedule.
Outlook
Since BIMCO’s last report in mid-April, the consolidation amongst carriers has continued. First, the three Japanese conglomerates merged their container lines into ONE (Ocean Network Express), then there was COSCO’s takeover of OOCL and in August we saw the formation of the Korea Shipping Partnership (KSP).
Whereas ONE is a merger of business units, at least according to the US Federal Maritime Commission, that had to give a final decision - rejection or approval - to the US Department of Justice; KSP is not. At least not yet. It remains to be seen whether KSP can reap the benefits from the partnership which is needed to counter the pressure from harsh competition on its main intra-Asian trade lanes.
BIMCO sees 2015/2016 as the real low point of the present crisis and 2017 is a step in the right direction for the industry. Demand growth will most likely outstrip supply growth for the second year in a row. The last time we saw that, was in 2010-2011.
source:bimco.org
MACROECONOMICS: Labour market tightens but inflation remains subdued around the globe

In conclusion, the International Monetary Fund (IMF) expects global GDP growth of 3.5\% in 2017, adjusting EMDE up by 0.1 to 4.6\% and keeping advanced economies at 2.0\% as lower expectations for the US economy (down by -0.2 to 2.1\%) are balanced by stronger performance in the Euro area (up by +0.2 to 1.9\%) and Japan (up by +0.1 to 1.3\%).
Investors’ appetite for risk has also returned, demonstrated by low volatility in the financial markets despite geo-political risk and policy uncertainty.
One of the global indicators pointing upwards in April was industrial production, which has increased for the four largest economic areas since January 2017. The indicator has continued to show strength throughout first half of 2017 and is a clear sign of positive development in the industries affecting global shipping the most. This is mirrored by a pick-up in global trade.

The GDP growth rate forecasts for Europe and Japan have been upgraded in the most recent outlook by both the IMF and the World Bank. It comes on the back of stronger domestic demand and higher export figures, coinciding with growing industrial production. In May 2017, the European Union (EU) experienced year-on-year industrial production growth of 4.1\%, the highest growth rate in more than six years.
Japanese industrial production has rebounded from a bad and volatile period in 2014-2016, to achieve positive year-on-year growth eight months in a row, although it comes on the back of a weak 2016.
Similar to Japan, following two years of negative industrial production growth rates, positive rates have returned in the US. Industrial production dropped as oil prices fell. However, as oil prices have now stabilised, growth has returned and industrial production now accounts for 19\% of the US GDP.
However, the GDP growth in other sectors of the US economy has not shown the expected strength and together with the expectation of fiscal policy being less expansionary than anticipated, the IMF and World Bank have both revised their expectation for US GDP growth in 2017, downwards.
US
US labour market conditions continued to improve during 2017, and the unemployment rate for Q2 2017 fell to 4.36\%, the lowest level since Q1 2001. However, wage and productivity growth have remained sluggish, and hourly earnings have not increased, as had been the case in previous periods with low unemployment. There is optimism that the tightening of the labour market will trigger wage growth as weak productivity in 2016 may have constrained wages into 2017.
The downgrading of US GDP growth rates by -0.2\% for 2017 by the IMF, is the largest downward revision for a major economy in their recent update. It reflects the high possibility that the US will implement trade policies triggering retaliatory measures which could damage both the US and counterparties and reduce the possibility of tax cuts and investments in infrastructure to create stronger growth.
Europe
Despite optimism in the financial markets, stronger than anticipated domestic demand and reduced political uncertainty in the euro area, there is still a job to be done by policy makers and the European Central Bank (ECB) to avoid premature interest rate hikes, as seen in 2011.
The unemployment rate has continued to drop in 2016 and into 2017, reaching 9.2\% in the second quarter of 2017. This is the lowest level since Q1 2009, after the unemployment rate peaked at 12.1\% in 2013. However, the rate is still far above the structural level of unemployment, which signals that labour is still abundant in the Euro area. Moreover, capital goods could be used more productively.
Core inflation has risen in 2017 and is currently 1.3\%, but still below the ECB target of 2\%. However, while inflation is below the ECB target, it has accelerated to the highest level in four years.
The fact that the unemployment rate is falling and core inflation is increasing are encouraging signs for the Euro area and will be focal points when the ECB decides whether to extend the current quantitative easing programme or not, at its next meeting on 7 September 2017.

While the IMF has lifted its expectations for GDP growth in the euro area for 2017, by 0.2 to 2.1\%, it has downgraded its expectations for the United Kingdom by 0.3 to 1.7\%.
Asia
China’s GDP grew 6.9\% year-on-year in both Q1 and Q2 2017 and remains on track for its first annual growth acceleration since 2010. As a result, the IMF has upgraded its projections for China by 0.1 percentage point for 2017 and 0.2 percentage points for 2018. The stronger growth in GDP was driven by increasing growth in exports and a robust increase in consumption, despite limited state owned and private investment growth in fixed assets.
China has experienced year-on-year growth in fixed assets investments (FAI) stabilising at a level around 8.6\% in 2017. Despite a drop in private FAI for 2016, the growth rate for private investments has surged in 2017, and the FAI from state owned enterprises have also seen lower growth rates. Private investments are the main driver for FAI, as it represents 60\% of the total investments.

The notable shift in FAI from private and state-owned enterprises since January 2016 might be due to changes in the segregation of enterprise ownership. This raises the question whether the new segregation is the true picture of investments from private and State-Owned Enterprises (SOE). The National Bureau of Statistics in China has not indicated the reason for the change.
Japan experienced GDP growth of 4\% in the second quarter of 2017. The growth of 4\% was not a one off, and was either caused by a surge in inventories, which will be worked down in the coming quarters or was a spike due to an imbalance between exports and imports. The GDP growth was primarily driven by strong domestic demand and consumption, while net exports were a slight drag.
This might indicate that the tight labour market is finally starting to lift consumer spending and will soon boost wages. Growing wages are a must to defeat low inflation.
The Japanese unemployment rate in Q2 2017 was 2.9\%, which is the lowest quarterly level together with Q1 2017 since Q2 1994. Impressively low, but also a result of a stagnating labour force, illustrated by weak Japanese wage growth.
Outlook
Despite global indicators for the four largest economies showing continued strength in the first half of 2017, global risk remains. Escalating trade restrictions could easily derail the fragile recovery in trade and it is vital that policymakers don’t underestimate the importance of nurturing the recovery and fostering long term growth.
With sustained low core inflation and soft upward pressure on wages, it is essential that expectations are consistently lifted in line with targets and output gaps using fiscal policies.
In the coming period, we might see the central banks in advanced economies gradually normalizing their monetary policy, as inflation increases and labour abundancy diminishes. Similar to what is being seen in the US, where the tightening cycle is ahead of other major advanced economies.
source:bimco.org
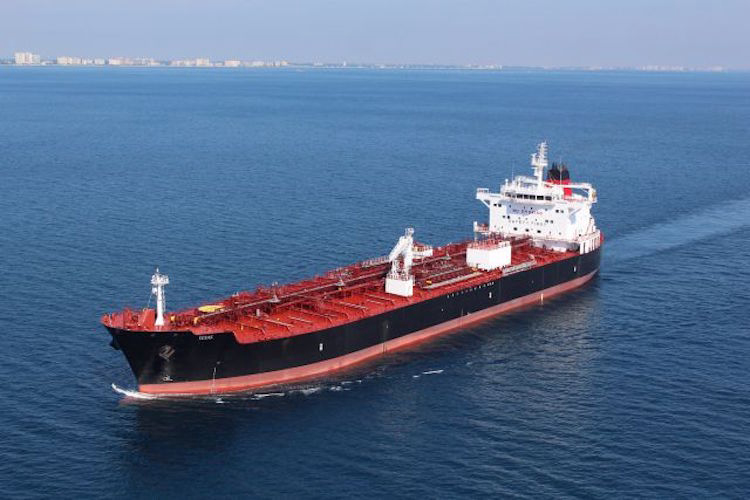
TANKER SHIPPING: All eyes on oil market rebalancing – is it happening or not?
Demand
The one key factor to watch is the one thing that’s impossible to measure accurately on a global scale - oil stocks.
Global stocks for both crude oil and oil products rose significantly following the sharp fall in crude oil prices in the second half of 2014. But while this may seem to be in the past, it is still haunting the oil market and the oil tanker market. Demand in the tanker market is below normal levels and will only increase once the global oil stocks have been reduced.
Tanker shipping enjoyed above-normal demand as the stocks were building, but will continue to suffer as long as they remain high. The strong fleet growth in 2016 and 2017 only makes the downturn tougher on owners and operators struggling with stretched balance sheets, as earnings drop.
So, what is the right level of future oil stocks? It’s anyone’s guess now, but BIMCO believes that it is much lower than the estimates of the ‘money managers and bull traders’, but not as low as the level seen before the rise in 2014.
Global oil demand has grown markedly since then, and it seems fair to strive towards a level equal to a given number of days of supply, rather than a multi-annual absolute average.

BIMCO believes that some rebalancing has taken place over recent months, but much more is needed. Data regarding OECD-stocks only provides an indication of how the market is developing in one part of the world. Likewise, any draw down on stocks in the US should not be used as a global proxy, as the US only holds 1/6 of OECD stocks.
Bearing in mind that if global stocks have a surplus of 180 million barrels, it will take one whole year to reduce that at the rate of 0.5m barrels per day (bpd). As can be seen from the chart, the EIA (Energy Information Administration) has estimated that global liquid fuel stocks have risen by more than 1m bpd on average for six quarters in a row, that’s at least 540 million barrels of stock stored.
Seaborne trade
The global tanker industry is directly linked to the global oil industry. Right now, demand for seaborne transport of oil is below normal and fleet growth is high, which means that the fundamental balance is uneven. The result is declining tanker earnings with the main culprit being the fast-growing fleet.
We tend to forget however, that demand is not that bad. Looking beyond the regular draw on stocks, other demand factors remain strong. US gross input to petroleum refineries hit an all-time high in the week ending May 26, when 17.7m bpd were refined. Global oil demand as forecasted by IEA (International Energy Agency) may pass the 100m bpd mark for the first time, hitting 100.1m bpd in Q4-2018, and for 2017, growth has been revised up to 1.5m bpd. In addition, China is still believed to be increasing its strategic petroleum reserves (SPR) and crude oil imports were up by 13.8\% year-on-year in the first half of 2017 hitting 8.55m bdp on average.
Earnings for VLCCs in the spot market are as low as $8,775 per day, a level last seen during the difficult years of 2011-2013. The year-to-date average stands at $20,489 per day. Based on a set of assumptions, BIMCO estimates that spot trading VLCCs built in 2005 and later are loss making at that level, because of heavy financing costs. For the whole industry, any profits made from older ships do not outweigh the losses of the younger vessels.
As earnings very often follow from one segment to the next, suezmax and aframax ships are suffering too.

Earnings for the oil product tanker sector on average appears to have stopped falling, as they dropped steadily throughout 2016, reaching the present level at the end of the year. BIMCO is forecasting that average earnings in this segment will also be loss-making.
MRs have made no more than $10,040 per day, while Handysize have dropped to $7,658 in 2017 down from $8,962 in 2016. LR1s have a year-to-date average of $7,873 and LR2 $9,235 per day.
Supply
The tanker fleet is growing strongly. By mid-August, the crude oil tanker fleet had grown 4.3\% year-to-date, and the oil product tanker fleet had grown by 3.6\%.
Deliveries into the crude oil tanker fleet, include 36 VLCC, 41 suezmax and 23 aframax plus some panamax and smaller units. The crude oil tanker fleet expansion remains on course for a six-year-high, measured in DWT, however, the fleet growth percentage is down from last years’ 5.9\%, to 4.7\% for the full year of 2017.
Meanwhile, 23 LR2, equal to 45\% of the total added oil product tanker capacity overshadowed the recent years’ favourite: MR, as ‘only’ 38 new ships were delivered during the first seven and a half months.
The fast-growing fleets come as no surprise. But the continued low levels of demolition in both tanker segments are a roadblock to changes to the current poor earnings environment in the freight market and a possible recovery.
The fact that one VLCC was reportedly sold for demolition in April, but was then subsequently sold to a new owner, one month later at a higher price, seems irrational as overcapacity is increasing amongst crude oil tankers in general and VLCC’s in particular.

Amongst oil product tankers, just two LR2 left the fleet in 2017, a year that has seen MR, almost exclusively being demolished.
BIMCO continues to believe that demolition will pick up during the final five months of 2017, but the actual demolition rate only amounted to one third of forecasted full year levels by mid-August. The ongoing poor freight market conditions will drive demolition.
Over the last four months, shipyards have been busy signing new orders for tankers. Amongst them were 14 LR2 and 14 suezmax ordered in June, supplementing the 9 VLCC’s ordered in May. In total 32 VLCCs have now been ordered in 2017, up from 12 in the first quarter.

Assuming 2.5m DWT of oil product tanker capacity will be demolished; fleet growth will hit 4.1\% in 2017. Should demolition fall short of that by 1m DWT, the fleet will expand by 4.8\%.
Outlook
Not a day goes by without a story about global oil stock levels. Many of them trying to be the messenger of positive news for the oil market and the tanker shipping market. However, sometimes business interests and wishful thinking are not supported by facts. Money managers and financial traders run businesses which are very different from the shipping industry.
As OPEC compliance with the extended output cut falls to hit 78\% in July (IEA), US shale oil production is rising, and Nigeria and Libya have some export potential left. So, oil supply seems to rise alongside oil demand.
On the geopolitical scene, Venezuelan exports to the US amounting to 0.8m bpd for the past four years face a low risk. As Venezuela’s crude oil is very heavy and sour, it has no obvious substitutes, and is compatible to sophisticated refineries in the US Gulf (including some Venezuelan owned). There may be US sanctions aimed at political targets, but we do not expect oil exports to be hit hard.
Following its annual peak in August, the global refinery runs will decline seasonally due to maintenance, by 1.5m bpd during September and October, before throughput picks up again in November for the winter season.
source: bimco.org
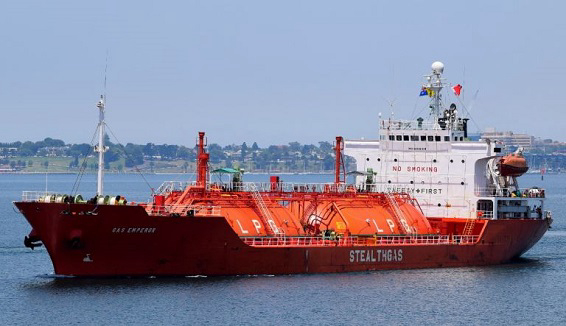
STEALTHGAS INC. Reports Second Quarter 2017 Financial and Operating Results
OPERATIONAL AND FINANCIAL HIGHLIGHTS
· Operational utilization of 94.9\% in Q2 17’ (91.2\% in Q2 16’).
· Commercial off hire days reduced in Q2 17’ by 41.7\% compared to Q2 16’.
· Approximately 83\% of fleet days secured on period charters for the remainder of 2017, with a total of approximately $180 million in contracted revenues.
· Sale of two of our oldest vessels, the Gas Icon (1994 built) and the Gas Emperor (1994 built), both for further trading.
· Further delivery delay of two of the remaining 22,000 cbm LPG semi refrigerated vessels- at zero cost.
· Record revenues of $39.3 million, increased compared to Q2 16’ by 10.1\%.
· Adjusted EBITDA of $15.5 million in Q2 17’ compared to $11.8 million in Q2 16’.
· Moderate gearing as debt to assets stands at about 40\%.
· Cash at hand of $43.3 million with operating cashflow of $24.5 million.
Second Quarter 2017 Results:
· Revenues for the three months ended June 30, 2017 amounted to $39.3 million, an increase of $3.6 million, or 10.1\%, compared to revenues of $35.7 million for the three months ended June 30, 2016, mainly due to increased fleet utilization and a slight increase in market rates.
· Voyage expenses and vessels’ operating expenses for the three months ended June 30, 2017 were $4.5 million and $14.4 million respectively, compared to $3.7 million and $15.2 million respectively, for the three months ended June 30, 2016. The $0.8 million increase in voyage expenses is mainly attributed to higher bunker costs due to increased oil prices. The 5.3\% decrease in vessels’ operating expenses compared to the same period of 2016 was mostly due to improved operating efficiency and a 10.6\% decrease in store costs.
· Drydocking costs for the three months ended June 30, 2017 and 2016 were $1.2 million and $1.5 million, respectively. The costs for the second quarter of 2017 corresponds to the drydocking of three vessels, while in the same period of 2016 the Company completed the drydocking of four vessels.
· Depreciation for both the three months ended June 30, 2017 and 2016 was $9.7 million.
· Included in the second quarter 2017 results were net losses from interest rate derivative instruments of $0.1 million. Interest paid on interest rate derivative instruments amounted to $0.1 million.
· The Company recorded an impairment loss of $3.2 million for three of its oldest vessels, two of which have been classified as held for sale, as of June 30, 2017.
· As a result of the above, for the three months ended June 30, 2017, the Company reported a net loss of $1.7 million, compared to a net loss of $1.6 million for the three months ended June 30, 2016. The weighted average number of shares for the three months ended June 30, 2017 was 39.8 million. Loss per share, basic and diluted, for the three months ended June 30, 2017 and 2016 amounted to $0.04.
· Adjusted net income was $1.5 million or $0.04 per share for the three months ended June 30, 2017 compared to adjusted net loss of $1.5 million or $0.04 per share for the same period of last year.
· EBITDA for the three months ended June 30, 2017 amounted to $12.2 million. Reconciliations of Adjusted Net Income, EBITDA and Adjusted EBITDA to Net Income are set forth below.
· An average of 53.4 vessels were owned by the Company during the three months ended June 30, 2017, compared to 53.0 vessels for the same period of 2016.
Six Months 2017 Results:
· Revenues for the six months ended June 30, 2017, amounted to $77.3 million, an increase of $5.1 million, or 7.1\%, compared to revenues of $72.2 million for the six months ended June 30, 2016, primarily due to improved market conditions.
· Voyage expenses and vessels’ operating expenses for the six months ended June 30, 2017 were $8.1 million and $29.3 million, respectively, compared to $7.6 million and $29.8 million for the six months ended June 30, 2016. The $0.5 million increase in voyage expenses was mainly due to the higher bunker prices prevailing in the first six months of 2017 compared to the same period of 2016. The $0.5 million decrease in vessels’ operating expenses was mainly driven by improved operating efficiency and a decrease in store costs that led to the decline of daily average operating cost by 1.5\% compared to the first six months of 2016.
· Drydocking Costs for the six months ended June 30, 2017 and 2016 were $1.9 million and $2.2 million, respectively, representing the costs of 5 and 7 vessels drydocked in the respective periods.
· Depreciation for the six months ended June 30, 2017, was $19.4 million, a $0.1 million increase from $19.3 million for the same period of last year.
· Included in the first six months of 2017 results are net losses from interest rate derivative instruments of $0.2 million. Interest paid on interest rate swap arrangements amounted to $0.2 million.
· The Company recorded an impairment loss of $3.2 million in the first six months of 2017 for three of its oldest vessels, two of which have been classified as held for sale.
· As a result of the above, the Company reported a net income for the six months ended June 30, 2017 of $0.3 million, compared to a net loss of $0.9 million for the six months ended June 30, 2016. The average number of shares outstanding as of June 30, 2017 was 39.8 million. Earnings per share for the six months ended June 30, 2017 amounted to $0.01 compared to loss per share of $0.02 for the same period of last year.
· Adjusted net income was $3.6 million, or $0.09 per share, for the six months ended June 30, 2017 compared to adjusted net loss of $1.3 million, or $0.03 per share, for the same period of last year.
· EBITDA for the six months ended June 30, 2017 amounted to $27.6 million. Reconciliations of Adjusted Net Income, EBITDA and Adjusted EBITDA to Net Income are set forth below. An average of 53.2 vessels were owned by the Company during the six months ended June 30, 2017, compared to 52.9 vessels for the same period of 2016.
· As of June 30, 2017, cash and cash equivalents amounted to $43.3 million and total debt amounted to $408.2 million. During the six months ended June 30, 2017 debt repayments amounted to $22.2 million.
Fleet Update Since Previous Announcement
The Company announced the conclusion of the following chartering arrangements:
· A three year bareboat charter for its 2009 built product tanker, the Stealth Bahla, with an international tanker operator until August 2020.
· A thirty months’ time charter for its 2016 built LPG carrier, the Eco Nical, with an oil major until December 2019.
· A one year time charter for its 2014 built LPG carrier, the Eco Invictus, with a major international LPG trader until October 2018.
· A one year time charter for its 2011 built LPG carrier, the Gas Cerberus, with a major international LPG trader until July 2018.
· A one year time charter for its 2003 built LPG carrier, the Gas Prodigy, with a major international LPG trader until September 2018.
· A one year time charter extension for its 2015 built LPG carrier, the Eco Czar, with a major international trading house until August 2018.
· A one year time charter for its 2006 built LPG carrier, the Gas Alice, with a national oil company until August 2018.
· A one year time charter extension for its 2006 built LPG carrier, the Gas Inspiration, with a major international LPG trader until September 2018.
· A one year time charter extension for its 2011 built LPG carrier, the Gas Elixir, with a major international LPG trader until March 2019.
· A one year time charter extension for its 2015 built LPG carrier, the Eco Enigma, with a major international LPG trader until January 2019.
· A four months’ time charter for its 1995 built LPG carrier, the Gas Texiana, with a major international trading house until November 2017.
· A six months’ time charter for its 1997 built LPG carrier, the Gas Monarch, with an international energy trader until February 2018.
· A three months’ time charter for its 1996 built LPG carrier, the Gas Nirvana, with a major international trading house until November 2017.
· A three months’ time charter extension for its 1996 built LPG carrier, the Gas Evoluzione, with a major international trading house until November 2017.
· A two months’ time charter for its 2006 built LPG carrier, the Gas Enchanted, with an international energy trader until September 2017.
With these charters, the Company has contracted revenues of approximately $180 million. Total anticipated voyage days of our fleet are about 83\% covered for the remainder of 2017 and 44\% covered for 2018.
Board Chairman Michael Jolliffe Commented
The second quarter of 2017 was quite encouraging for StealthGas. In spite of the low seasonal demand, we managed to achieve close to 95\% operational utilization, which is the second best, second quarter’s performance marked since the year 2012. Consequently, our revenues were higher than anticipated. In addition to this, we succeeded in decreasing our operating costs. So both these factors contributed to our profitability which, excluding the impairment charges of the quarter, was quite satisfactory and significantly improved compared to the second quarter of 2016. Going forward, we have secured more than 83\% of our fleet days in period charters and our market shows positive signs of improvement such as increase in rates, low orderbook and acceleration of the scrapping activity. In addition we succeeded in pushing back the deliveries of our second and third 22,000 cbm semi-ref eco newbuildings to the first quarter of 2018. Last but not least, we sold two of our oldest ships at a hefty premium over scrap showing increased confidence from buyers even for overage ships. Based on all of the above, we remain confident for the quarters to come.
DNV GL’s Digital Journey

Shipping has undergone a remarkable transformation over the past few decades. Advances in technology, new materials and new insights into the design, construction and operation of vessels mean that they are more complex, more efficient and larger than ever before. While the use of ship-to-shore data and greater digitalization is improving operations and performance, reducing maintenance and operational costs, as well as enhancing safety. DNV GL has been at the heart of this transformation for more than 150 years.
“For us, digitalization is not an end in itself, we see it as another means to fulfil our main purpose: ensuring safe operations at sea and protecting life, property and the environment,” says Knut Ørbeck- Nilssen, CEO of DNV GL – Maritime. “The role of class in ensuring the integrity of the vessel and safety of the crew will continue, but the way surveys are conducted may change significantly. Furthermore, digitalization enables us to become more efficient and improve our level of service,” he adds.
Elon Musk inspires No.1 miner to target electric vehicle boom
 |
| BHP Nickel West president Eduard Haegel |
“As we delved in to understand more about the lithium-ion battery market, it became clear that demand from EVs was accelerating,” Haegel said Wednesday in an interview. “It also became clear that we had competitive advantages.”
As a result, BHP approved a $43-million project to begin production at its refinery from April 2019 of nickel sulfate, a product needed for lithium-ion batteries. The move will make BHP the top exporter of the material, Haegel said in Kalgoorlie, Western Australia.
Global nickel demand could more than double by 2050, fuelled in part by rising electric-vehicle sales, Bloomberg Intelligence analyst Eily Ong wrote in a June report. Demand for nickel from lithium-ion batteries may rise to more than 190 000 metric tons a year by 2030 from about 5 200 tons in 2016, Bloomberg New Energy Finance analyst Julia Attwood forecast in April.
Melbourne-based BHP is holding talks with prospective customers across Asia and is seeking to open discussions with battery makers. The producer will tour Japan, South Koreaand China to discuss its plans next month, Haegel said in the interview.
“We have visited a swathe of different manufacturers,” Haegel said. “The next time round we are going to talk to battery manufacturing folk. As people become more aware of the limitations of supply, then those up and down the supply chain want to make sure that they’ve got security of supply.”
Targeting growth in the battery market may change the outlook for Nickel West. The business, with nickel mines to processing facilities, was excluded from the spin-off of smaller assets into South32 and an attempted sale was halted in 2014 after failing to attract a suitable offer. The company has taken $2.6-billion in pretax writedowns on the operation since 2012, according to filings.
Nickel usage in automotive batteries could quadruple if the share of electric vehicles in the global market reaches 10\%, Glencore CEO Ivan Glasenberg said in December. Rising demand from the battery sector will “have a disruptive impact” over the next 10 years on nickel, copper and cobalt markets, Independence Group NL CEO Peter Bradford said Tuesday in an interview with Bloomberg Television.
At present, batteries account for only about 3\% of demand, with the stainless steel industry accounting for about two-thirds of consumption, according to the International Nickel Study Group.
Perth-based nickel producer Western Areas has had visits from four groups in the past month seeking to secure future supply for lithium-ion batteries, CEO Dan Lougher said Wednesday in an interview. “That frequency tell us how the market is looking at this,” Lougher said. “The next stage will be people wanting to get into assets, and wanting to share in projects and provide capital.”
BHP will study a potential expansion to double the size of nickel sulfate output to 200000 metric tons and consider adding production of battery cathode precursors -- intermediate materials used in the production of batteries, Haegel said in a presentation to the Diggers and Dealers mining forum in Kalgoorlie.
www.bloomberg.com
Navios Maritime Containers Inc. Announces $50.0 Million Private Placement at $5.0 per Share
Navios Containers intends to use the proceeds for vessel acquisitions, working capital and general corporate purposes. The offering is expected to close on August 29, 2017.
Navios Maritime Partners L.P. (“Navios Partners”) will invest $10.0 million in the private placement and will own 40\% of the equity post-closing of the private placement. Each of Navios Partners and Navios Maritime Holdings Inc. (“Navios Holdings”) will also receive warrants, with a five-year term, for 6.8\% and 1.7\% of the newly issued equity respectively.
Clarksons Platou Securities AS acted as the Lead Manager and Sole Bookrunner, Fearnley Securities acted as the Senior Manager and S. Goldman Advisors LLC acted as Structuring Advisor.
About Navios Maritime Containers Inc.
Navios Maritime Containers Inc. is a growth vehicle dedicated to the container sector of the maritime industry. For more information, please visit our website at www.navioscontainers.com.
![]()
Powered by ![]() © Μaritimes 2019
© Μaritimes 2019