-
Home

-
Maritimes NEWS
-
Ports
- maritimes

maritimes
Cheniere Highlights the Power of Connection in 2022 Corporate Responsibility Report
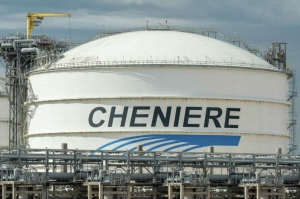
HOUSTON--(BUSINESS WIRE)-- Cheniere Energy, Inc. (NYSE American: LNG) today published its 2022 Corporate Responsibility Report, titled The Power of Connection, highlighting the company’s efforts to link U.S. energy supply with markets worldwide during a crucial moment in history, when energy security and energy transition goals have become key for countries around the world.
The Power of Connection also details Cheniere’s progress on environmental, social and governance (ESG) matters, including the company’s safety-first culture, commitment to the communities in which it operates, environmental management and strategic climate initiatives.
“In 2022, the power of Cheniere’s connection to the world was made clear. We connected abundant North American natural gas to markets where it was needed most and did so in a safe and responsible manner, helping to ensure hundreds of millions of people around the world had secure and reliable energy,” said Jack Fusco, Cheniere’s President and CEO. “We also advanced key initiatives that enhanced our environmental transparency and improved the sustainability of our product, including our science- and evidenced-based emissions programs and our sixth consecutive year of safety performance improvements.”
Highlights from Cheniere’s 2022 Corporate Responsibility Report include:
Bolstering Europe's energy security during an energy crisis, with over 460 LNG cargoes, or more than 70% of LNG produced by Cheniere, being delivered to the continent
Achieving record safety performance, with a Total Recordable Incident Rate of 0.05 and Lost Time Incident Rate of 0.00, for a sixth consecutive year of performance improvement
Commencing the issuance to all long-term customers of Cargo Emissions Tags, which provide estimated greenhouse gas emissions associated with each cargo produced at our facilities
Initiating Quantification, Monitoring, Reporting and Verification (QMRV) projects with midstream partners and at Cheniere’s liquefaction facilities, complementing the company’s upstream and shipping QMRV programs launched in 2021, and achieving publication of results in a peer-review scientific journal
Joining the Oil and Gas Methane Partnership 2.0, the United Nations Environment Programme’s flagship oil and gas methane emissions reporting and mitigation initiative
Expanding the weight of ESG metrics to 30% in our annual performance scorecard that applies to all employees
Tallying more than 15,000 volunteer hours by employees and contributing $1 million to historically underserved communities
The Power of Connection aligns with recommendations of the Task Force on Climate-Related Financial Disclosure (TCFD), the Sustainable Accounting Standards Board and other leading reporting standards. It focuses on seven key areas – Communities; Climate; Environment; Health and Safety; Team; Diversity, Equity and Inclusion; and Governance.
To read the full report, past reports and accompanying materials, visit the Report Center at Cheniere.com.
About Cheniere
Cheniere Energy, Inc. is the leading producer and exporter of liquefied natural gas (“LNG”) in the United States, reliably providing a clean, secure, and affordable solution to the growing global need for natural gas. Cheniere is a full-service LNG provider, with capabilities that include gas procurement and transportation, liquefaction, vessel chartering, and LNG delivery. Cheniere has one of the largest liquefaction platforms in the world, consisting of the Sabine Pass and Corpus Christi liquefaction facilities on the U.S. Gulf Coast, with total production capacity of approximately 45 million tonnes per annum (“mtpa”) of LNG in operation and an additional 10+ mtpa of expected production capacity under construction. Cheniere is also pursuing liquefaction expansion opportunities and other projects along the LNG value chain. Cheniere is headquartered in Houston, Texas, and has additional offices in London, Singapore, Beijing, Tokyo, and Washington, D.C.
For additional information, please refer to the Cheniere website at www.cheniere.com and Quarterly Report on Form 10-Q for the quarter ended June 30, 2023, filed with the Securities and Exchange Commission.
View source version on businesswire.com: https://www.businesswire.com/news/home/20230807358301/en/
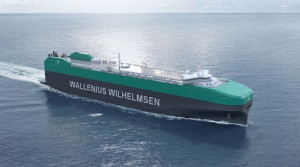
Wallenius Wilhelmsen’s next generation vessels are coming!
“I am very happy that we can launch this to the market now. I know it is expected from us, and that in order to keep our fleet size, we need to continue ordering vessels. However, with no clear direction on future fuel, this has not been an easy task. We needed time to assess what was the best option for us,” says Xavier Leroi, EVP & COO Shipping Services.
The wait is over! Wallenius Wilhelmsen is proud to share that we have signed a letter of intent for four firm, and eight optional, next generation vessels!
It’s been a long time coming, but after meticulous planning and hard work from everyone involved, we can finally share that we have signed a letter of intent for four next generation vessels (and up to eight optional units of 9,350CEU class methanol dual fuel pure care and truck carriers) with Jinling Shipyard (Jiangsu). The first vessels will start being delivered from the second half of 2026.
The Shaper Class
“There is an urgent need for our industry to transform over the next couple of years. As a company, we are determined to shape this industry and lead the way to capitalize effectively on changing circumstances, as we grow with customers and partners sharing our journey,” says Lasse Kristoffersen, CEO.
And these are not just four new ordinary vessels! We are committed to being a shaper, not an adapter. We want to be transformational in the fight against climate change and all of Wallenius Wilhelmsen’s new investments will contribute to the ambitious goals of reaching net-zero emissions by 2027.
As such, as a pledge to this ambition, it is only fitting that our new vessel class is named “The Shaper Class”.
We have high ambitions for the future. We want to be our customers’ first choice in shipping and we want to deliver an end-to-end net-zero emissions solution by 2027. Our new vessels will enable us to get closer to these goals. At the same time, we are the world’s largest RoRo vessel operator and will maintain a fleet of 125-135 vessels.
Lars Ekren, Senior Manager – Newbuildings and Conversions explains: “The process of developing our new design started over 1.5 year ago and the Newbuidlings team have been working in close collaboration with the designer (Delta Marin) and internal & external stakeholders during this period, to ensure the vessel design meets of safety requirements and is well suitable for our future short term & long-term operational needs,” he continues, “Energy efficiency & reducing GHG emissions is a top priority, and a lot of effort has put into ensuring the new vessels will significantly contribute to meeting our emission reduction targets!”
Our commitment
Our commitment is to continue to grow with our customers, and together, reach our net-zero emissions ambitions. We will do so by securing new builds and biofuels, as well as maintaining the 125-135 vessels on our fleet. We will evolve whilst nurturing our reliable services, tailored to our customers’ needs.
“To secure our number one position, we will continue to deliver great services with a competitive fleet, offering sustainable supply chain services both on land and at sea. We are already partnering with our customers on reducing emissions through biofuel and with the new vessels we can accelerate this towards net-zero. This requires new and more expensive fuels but both we and our customers are committed to secure this as soon as it can be made available,” says Leroi.
Our belief is that methanol is the fastest way to reach net-zero emission. As such, our choices going forward reflect that. These four vessels have been ordered to use alternative fuel sources, such as methanol, upon delivery. They will also be ammonia-ready and will be able to be converted as soon as ammonia becomes available in a safe and secure way.
So here’s to the “Shaper Class”. We hope you’re excited because together, we will shape the future!
Odfjell first to install suction sails on deep-sea chemical tanker
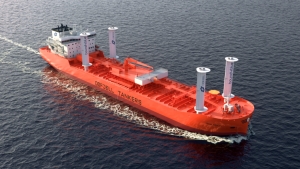
In partnership with bound4blue, a pioneering developer of wind-assisted propulsion technology, Odfjell will install the innovative eSAIL® system on a chemical tanker, making it the first tanker vessel in the world to harness this groundbreaking technology.
bound4blue’s eSAIL® system utilizes a cutting-edge wind-assisted propulsion system known as a suction sail. By promoting the use of wind power to propel vessels, this technology significantly reduces fuel consumption and pollutant emissions.
Odfjell has actively pursued decarbonization initiatives for many years, and recently documented a 51% improved carbon intensity compared to the 2008 baseline. The deployment of bound4blue's eSAIL® system represents another significant milestone in the company’s implementation of innovative solutions to increase its fleet’s energy efficiency.
"Since 2020, we have been studying sail technologies as a potential energy efficiency measure for our fleet, and we are excited to now take the next step by partnering with bound4blue to implement their pioneering eSAIL® system on one of our chemical tankers," said Jan Opedal, Manager Projects at Odfjell. “This technology has significant potential to reduce emissions by harvesting the energy on the ship itself and transforming it directly into a forward thrust.”
Bow Orion_1280x720px.png
Redefining sailing: Merging tradition and innovation on the way to zero emissions
Odfjell's partnership with bound4blue aims to expand access to the eSAIL® technology within the tanker shipping segment and further contribute to the industry's efforts in decarbonization. The decision to collaborate with bound4blue was supported by an extensive study conducted by SSPA, evaluating various Wind Assisted Propulsion Systems (WAPS) for the Odfjell fleet.
“This project marks another leap in our dedication to decarbonization. As the first tanker company to test the suction-sail technology, we demonstrate our innovative capabilities and dedication to a more sustainable shipping sector,” said Erik Hjortland, Odfjell’s Vice President of Technology. “We all have a responsibility to use as few resources as possible, and Odfjell’s long-time efforts in energy efficiency have significantly reduced our fleet’s emissions. The work continues, and we look forward to documenting further improvements with the installation of suction sails.”
“We are thrilled to team up with Odfjell for our first-ever installation in the tanker segment. They are true pioneers in innovation and sustainability, setting the bar for decarbonization in the industry. We are pleased that they have chosen our technology after their thorough analysis, confirming that we are headed in the right direction. Working with their open and collaborative team has been fantastic, and we are confident that our joint efforts will unlock significant value for the industry,” said David Ferrer, CTO of bound4blue."
The pioneer installation will be completed in 2024.
Imperial Petroleum Inc. reports second quarter and six months 2023 financial and operating results
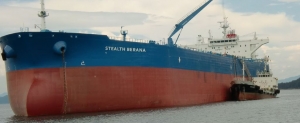
ATHENS, GREECE, August 10, 2023 - IMPERIAL PETROLEUM INC. (NASDAQ: IMPP, the “Company”), a ship-owning company providing petroleum products, crude oil and dry bulk seaborne transportation services, announced today its unaudited financial and operating results for the second quarter and six months ended June 30, 2023.
OPERATIONAL AND FINANCIAL HIGHLIGHTS
Fleet operational utilization of 75.4% in Q2 23’ with 28 days of technical off hire and 129 days of vessel repositioning.
68.5% of fleet calendar days equivalent to 734 days in Q2 23’ were dedicated to spot activity.
Revenues of $59.0 million in Q2 23’ - up $47.7 million or 422.1% from Q2 22’.
Net income of $16.8 million in Q2 23’ up by $16.7 million compared to Q2 22’.
Adjusted Net income[1] of $26.6 million in Q2 23’ up by $26.5 million compared to Q2 22’ or 26,500%.
Adjusted EBITDA1 of $30.8 million in Q2 23’ up by $27.8 million or 926.7% from Q2 22’.
Cash and cash equivalents including time deposits of $98.6 million as of June 30, 2023 – a strong cash balance in spite of utilizing within Q2 23’ an amount of $45.9 million for the repayment of all outstanding loans.
As of June 30, 2023 Imperial Petroleum has zero debt on its balance sheet.
In the 1H 23’ the Company generated a Net Income of $52.6 million corresponding to a basic EPS of $3.17.
In the 1H 23’ the Company generated an Adjusted Net Income of $62.6 million corresponding to an Adjusted basic EPS1 of $3.79.
Spin off of two of our four Handysize drybulk carriers to a separate listed entity called C3is Inc. on June 21, 2023.
Imperial Petroleum retains an interest in C3is Inc. through ownership of 600,000 Series A Convertible Preferred Shares of C3is Inc.
In July 2023, the Company sold its Aframax tanker to C3is Inc. for a consideration of $43 million.
Six Months 2023 Results:
Revenues for the six months ended June 30, 2023 amounted to $124.5 million, an increase of $108.0 million, or 654.5%, compared to revenues of $16.5 million for the six months ended June 30, 2022, primarily due to the increase in the average number of our vessels and improved market conditions resulting in higher rates particularly in the spot tanker market.
Voyage expenses and vessels’ operating expenses for the six months ended June 30, 2023 were $36.1 million and $13.9 million, respectively, compared to $4.9 million and $5.1 million, respectively, for the six months ended June 30, 2022. The $31.2 million increase in voyage expenses is mainly due to the increase in the spot days of our fleet by 1,009 days (458.6%). The $8.8 million increase in vessels’ operating expenses was primarily due to the increase in the average number of vessels in our fleet by approximately six vessels.
Drydocking costs for the six months ended June 30, 2023 and 2022 were $1.3 million and nil, respectively. This increase is due to the fact that during the six months ended June 30, 2023 two of our Handysize drybulk carriers underwent drydocking.
General and administrative costs for the six months ended June 30, 2023 and 2022 were $2.5 million and $0.5 million, respectively. This rise is mainly attributed to $1.1 million of stock-based compensation expense along with a rise in reporting costs related to our spin off project.
Depreciation for the six months ended June 30, 2023 was $8.7 million, a $3.8 million increase from $4.9 million for the same period of last year, due to the increase in the average number of our vessels.
Interest and finance costs for the six months ended June 30, 2023 and 2022 were $1.8 million and $0.5 million, respectively. The $1.8 million of costs for the six months ended June 30, 2023 relate mainly to $1.3 million of interest charges incurred up to the full repayment of all outstanding loans concluded in April 2023 along with the full amortization of $0.5 million of loan related charges following the repayment of the Company’s outstanding debt.
Interest income for the six months ended June 30, 2023 and 2022 was $2.1 million and $0.04 million, respectively. The increase is attributed to our time deposits during the period at favourable time deposit rates.
Impairment loss for the six months period ended June 30, 2023 stood at $9.0 million, and related to the spin-off of two of four drybulk carriers to C3is Inc. The decline of drybulk vessels’ fair values compared to one year ago when these vessels were acquired resulted in the incurrence of impairment loss.
As a result of the above, the Company reported net income for the six months ended June 30, 2023 of $52.6 million, compared to a net income of $0.3 million for the six months ended June 30, 2022. The weighted average number of shares outstanding, basic, for the six months ended June 30, 2023 was 15.9 million. Earnings per share, basic and diluted, for the six months ended June 30, 2023 amounted to $3.17 and $2.78, respectively compared to a loss per share, basic and diluted, of $0.81 and $0.81 for the six months ended June 30, 2022.
Adjusted Net Income was $62.6 million corresponding to an Adjusted EPS, basic of $3.79 for the six months ended June 30, 2023 compared to adjusted net income of $0.3 million, or $0.81 loss per share, basic, for the same period of last year.
EBITDA for the six months ended June 30, 2023 amounted to $60.9 million while Adjusted EBITDA for the six months ended June 30, 2023 amounted to $71.0 million. Reconciliations of Adjusted Net Income, EBITDA and Adjusted EBITDA to Net Income are set forth below.
An average of 10.9 vessels were owned by the Company during the six months ended June 30, 2023 compared to 5.0 vessels for the same period of 2022.
As of June 30, 2023, cash and cash equivalents including time deposits amounted to $98.6 million and total debt amounted to nil. During the six months ended June 30, 2023 debt repayments amounted to $70.4 million.
Fleet Employment Table
As of August 10, 2023, the profile and deployment of our fleet is the following:
|
Name |
|
Year |
|
Country |
|
Vessel Size |
|
Vessel |
|
Employment |
|
Daily Charter |
|
Expiration of |
||||||||||||||
|
Tankers |
|
|
|
|
|
|
|
|||||||||||||||||||||
|
Magic Wand |
|
2008 |
|
Korea |
|
47,000 |
|
MR product tanker |
|
Spot |
||||||||||||||||||
|
Clean Thrasher |
|
2008 |
|
Korea |
|
47,000 |
|
MR product tanker |
|
Spot |
|
|
||||||||||||||||
|
Clean Sanctuary (ex. Falcon Maryam) |
|
2009 |
|
Korea |
|
46,000 |
|
MR product tanker |
|
Spot |
|
|
||||||||||||||||
|
Clean Nirvana |
|
2008 |
|
Korea |
|
50,000 |
|
MR product tanker |
|
Spot |
|
|
||||||||||||||||
|
Clean Justice |
|
2011 |
|
Japan |
|
47,000 |
|
MR product tanker |
|
Spot |
|
|
||||||||||||||||
|
Suez Enchanted |
|
2007 |
|
Korea |
|
160,000 |
|
Suezmax tanker |
|
Spot |
|
|
||||||||||||||||
|
Suez Protopia |
|
2008 |
|
Korea |
|
160,000 |
|
Suezmax tanker |
|
Spot |
|
|
||||||||||||||||
|
Drybulk Carriers |
|
|
|
|
|
|
|
|||||||||||||||||||||
|
Eco Wildfire |
|
2013 |
|
Japan |
|
33,000 |
|
Handysize drybulk |
|
Spot |
|
|
||||||||||||||||
|
Glorieuse |
|
2012 |
|
Japan |
|
38,000 |
|
Handysize drybulk |
|
Time Charter |
|
$13,500 |
|
October 2023 |
||||||||||||||
|
Fleet Total |
|
|
|
|
628,000 dwt |
|
|
|
|
|
||||||||||||||||||
|
(1) |
Earliest date charters could expire. |
CEO Harry Vafias Commented
Within the first six months of 2023 our company managed to generate an adjusted net income of $62.6 million corresponding to a Basic Earnings Per Share of $3.79 which is well above our current share price. Compared to the first six months of 2022 our increase in net income was in the order of 20,500%. Our strong performance is unquestionable but so is the fact that we are significantly undervalued. We have a fleet valued at about $225 million, zero debt and about $100 million in cash. The outlook for the tanker market remains favourable whereas there might be opportunities in the dry bulk sector as dry ship values are dropping. We will continue to capture this favourable momentum generating strong results while growing our Company further.
Conference Call details:
On August 10, 2023 at 11:00 am ET, the company’s management will host a conference call to discuss the results and the company’s operations and outlook.
Online Registration:
Conference call participants should pre-register using the below link to receive the dial-in numbers and a personal PIN, which are required to access the conference call.
https://register.vevent.com/register/BI77731313e63f47b6b978bda7d8b7ca62
Slides and audio webcast:
There will also be a live and then archived webcast of the conference call, through the IMPERIAL PETROLEUM INC. website (www.ImperialPetro.com). Participants to the live webcast should register on the website approximately 10 minutes prior to the start of the webcast.
About IMPERIAL PETROLEUM INC.
Imperial Petroleum Inc. is a ship-owning - company providing petroleum products, crude oil and drybulk seaborne transportation services. The Company owns a total of nine vessels; five M.R. product tankers, two Suezmax tankers and two Handysize dry bulk carriers with a total capacity of 628,000 deadweight tons (dwt). Imperial Petroleum Inc.’s shares of common stock and 8.75% Series A Cumulative Redeemable Perpetual Preferred Stock are listed on the Nasdaq Capital Market and trade under the symbols “IMPP” and “IMPPP”, respectively.
Forward-Looking Statements
Matters discussed in this release may constitute forward-looking statements. Forward-looking statements reflect our current views with respect to future events and financial performance and may include statements concerning plans, objectives, goals, strategies, future events or performance, and underlying assumptions and other statements, which are other than statements of historical facts. The forward-looking statements in this release are based upon various assumptions, many of which are based, in turn, upon further assumptions, including without limitation, management’s examination of historical operating trends, data contained in our records and other data available from third parties. Although IMPERIAL PETROLEUM INC. believes that these assumptions were reasonable when made, because these assumptions are inherently subject to significant uncertainties and contingencies which are difficult or impossible to predict and are beyond our control, IMPERIAL PETROLEUM INC. cannot assure you that it will achieve or accomplish these expectations, beliefs or projections. Important factors that, in our view, could cause actual results to differ materially from those discussed in the forward-looking statements include the impact of any lingering impact of the COVID-19 pandemic and efforts throughout the world to contain its spread, the strength of world economies and currencies, general market conditions, including changes in charter hire rates and vessel values, charter counterparty performance, changes in demand that may affect attitudes of time charterers to scheduled and unscheduled drydockings, shipyard performance, changes in IMPERIAL PETROLEUM INC’s operating expenses, including bunker prices, drydocking and insurance costs, ability to obtain financing and comply with covenants in our financing arrangements, performance of counterparty to our vessel sale agreement, or actions taken by regulatory authorities, potential liability from pending or future litigation, domestic and international political conditions, the conflict in Ukraine and related sanctions, potential disruption of shipping routes due to accidents and political events or acts by terrorists.
Risks and uncertainties are further described in reports filed by IMPERIAL PETROLEUM INC. with the U.S. Securities and Exchange Commission.
Fleet Fleet Deployment
For information on our fleet and further information:
Visit our website at www.ImperialPetro.com
Fleet Data:
The following key indicators highlight the Company’s operating performance during the periods ended June 30, 2022 and June 30, 2023.
|
FLEET DATA |
Q2 2022 |
Q2 2023 |
6M 2022 |
6M 2023 |
|
Average number of vessels (1) |
6.0 |
11.8 |
5.0 |
10.9 |
|
Period end number of owned vessels in fleet |
8 |
10 |
8 |
10 |
|
Total calendar days for fleet (2) |
542 |
1,072 |
906 |
1,981 |
|
Total voyage days for fleet (3) |
539 |
1,044 |
903 |
1,947 |
|
Fleet utilization (4) |
99.4% |
97.4% |
99.7% |
98.3% |
|
Total charter days for fleet (5) |
346 |
310 |
683 |
718 |
|
Total spot market days for fleet (6) |
193 |
734 |
220 |
1,229 |
|
Fleet operational utilization (7) |
82.5% |
75.4% |
89.1% |
79.8% |
1) Average number of vessels is the number of owned vessels that constituted our fleet for the relevant period, as measured by the sum of the number of days each vessel was a part of our fleet during the period divided by the number of calendar days in that period.
2) Total calendar days for fleet are the total days the vessels we operated were in our possession for the relevant period including off-hire days associated with major repairs, drydockings or special or intermediate surveys.
3) Total voyage days for fleet reflect the total days the vessels we operated were in our possession for the relevant period net of off-hire days associated with major repairs, drydockings or special or intermediate surveys.
4) Fleet utilization is the percentage of time that our vessels were available for revenue generating voyage days, and is determined by dividing voyage days by fleet calendar days for the relevant period.
5) Total charter days for fleet are the number of voyage days the vessels operated on time or bareboat charters for the relevant period.
6) Total spot market charter days for fleet are the number of voyage days the vessels operated on spot market charters for the relevant period.
7) Fleet operational utilization is the percentage of time that our vessels generated revenue, and is determined by dividing voyage days excluding commercially idle days by fleet calendar days for the relevant period.
Reconciliation of Adjusted Net Income, EBITDA, adjusted EBITDA and adjusted EPS:
Adjusted net income represents net income before impairment loss and share based compensation. EBITDA represents net income before interest and finance costs, interest income and depreciation. Adjusted EBITDA represents net income before interest and finance costs, interest income, depreciation, impairment loss, and share based compensation.
Adjusted EPS represents Adjusted net income divided by the weighted average number of shares. EBITDA, adjusted EBITDA, adjusted net income and adjusted EPS are not recognized measurements under U.S. GAAP. Our calculation of EBITDA, adjusted EBITDA, adjusted net income and adjusted EPS may not be comparable to that reported by other companies in the shipping or other industries. In evaluating Adjusted EBITDA, Adjusted net income and Adjusted EPS, you should be aware that in the future we may incur expenses that are the same as or similar to some of the adjustments in this presentation.
EBITDA, adjusted EBITDA, adjusted net income and adjusted EPS are included herein because they are a basis, upon which we and our investors assess our financial performance. They allow us to present our performance from period to period on a comparable basis and provide investors with a means of better evaluating and understanding our operating performance.
|
(Expressed in United States Dollars, |
Second Quarter Ended June 30th, |
Six Months Period Ended June 30th, |
||
|
|
2022 |
2023 |
2022 |
2023 |
|
Net Income - Adjusted Net Income |
||||
|
Net income |
85,719 |
16,826,485 |
304,101 |
52,550,587 |
|
Plus impairment loss |
-- |
8,996,023 |
-- |
8,996,023 |
|
Plus share based compensation |
-- |
789,648 |
-- |
1,091,189 |
|
Adjusted Net Income |
85,719 |
26,612,156 |
304,101 |
62,637,799 |
|
Net income - EBITDA |
||||
|
Net income |
85,719 |
16,826,485 |
304,101 |
52,550,587 |
|
Plus interest and finance costs |
243,901 |
459,166 |
452,915 |
1,810,769 |
|
Less interest income |
(44,140) |
(851,930) |
(44,140) |
(2,131,146) |
|
Plus depreciation |
2,734,165 |
4,601,209 |
4,902,831 |
8,690,061 |
|
EBITDA |
3,019,645 |
21,034,930 |
5,615,707 |
60,920,271 |
|
Net income - Adjusted EBITDA |
||||
|
Net income |
85,719 |
16,826,485 |
304,101 |
52,550,587 |
|
Plus impairment loss |
-- |
8,996,023 |
-- |
8,996,023 |
|
Plus share based compensation |
-- |
789,648 |
-- |
1,091,189 |
|
Plus interest and finance costs |
243,901 |
459,166 |
452,915 |
1,810,769 |
|
Less interest income |
(44,140) |
(851,930) |
(44,140) |
(2,131,146) |
|
Plus depreciation |
2,734,165 |
4,601,209 |
4,902,831 |
8,690,061 |
|
Adjusted EBITDA |
3,019,645 |
30,820,601 |
5,615,707 |
71,007,483 |
|
EPS - Adjusted EPS |
||||
|
Net income |
85,719 |
16,826,485 |
304,101 |
52,550,587 |
|
Adjusted net income |
85,719 |
26,612,156 |
304,101 |
62,637,799 |
|
Weighted average number of shares, basic |
7,503,881 |
16,816,597 |
4,359,423 |
15,940,369 |
|
EPS - Basic |
(0.44) |
0.91 |
(0.81) |
3.17 |
|
Adjusted EPS - Basic |
(0.44) |
1.46 |
(0.81) |
3.79 |
Imperial Petroleum Inc.
Unaudited Consolidated Statements of Income
(Expressed in United States Dollars, except for number of shares)
|
Quarters Ended June 30, |
|
Six Month Periods Ended June 30, |
|||||||||
|
2022 |
2023 |
2022 |
2023 |
||||||||
|
|
|||||||||||
|
Revenues |
|||||||||||
|
Revenues |
11,348,271 |
59,044,221 |
16,464,649 |
124,465,322 |
|||||||
|
Expenses |
|||||||||||
|
Voyage expenses |
4,263,884 |
18,522,418 |
4,721,312 |
34,600,245 |
|||||||
|
Voyage expenses - related party |
141,591 |
736,269 |
203,462 |
1,546,799 |
|||||||
|
Vessels' operating expenses |
3,290,751 |
6,885,309 |
5,034,767 |
13,761,185 |
|||||||
|
Vessels' operating expenses - related party |
22,500 |
89,333 |
37,500 |
154,333 |
|||||||
|
Drydocking costs |
-- |
696,934 |
-- |
1,318,310 |
|||||||
|
Management fees |
209,815 |
473,880 |
341,625 |
871,640 |
|||||||
|
General and administrative expenses |
412,669 |
1,487,436 |
527,985 |
2,466,405 |
|||||||
|
Depreciation |
2,734,165 |
4,601,209 |
4,902,831 |
8,690,061 |
|||||||
|
Impairment loss |
-- |
8,996,023 |
-- |
8,996,023 |
|||||||
|
Total expenses |
11,075,375 |
|
42,448,811 |
|
15,769,482 |
|
72,405,001 |
||||
|
|
|
|
|
|
|
|
|
||||
|
Income from operations |
272,896 |
|
16,555,410 |
|
695,167 |
|
52,060,321 |
||||
|
Other (expenses)/income |
|||||||||||
|
|
Interest and finance costs |
(243,901) |
(459,166) |
(452,915) |
(1,810,769) |
||||||
|
Interest income |
44,140 |
851,930 |
44,140 |
2,131,146 |
|||||||
|
Dividend income from related party |
-- |
20,833 |
-- |
20,833 |
|||||||
|
Foreign exchange gain/(loss) |
12,584 |
(142,522) |
17,709 |
149,056 |
|||||||
|
Other (expenses)/income, net |
(187,177) |
|
271,075 |
|
(391,066) |
|
490,266 |
||||
|
Net Income |
85,719 |
|
16,826,485 |
|
304,101 |
|
52,550,587 |
||||
|
|
|
||||||||||
|
(Loss)/Earnings per share[2] |
|
|
|
|
|
|
|||||
|
- Basic |
(0.44) |
0.91 |
(0.81) |
3.17 |
|||||||
|
- Diluted |
(0.44) |
0.73 |
(0.81) |
2.78 |
|||||||
|
Weighted average number of shares2 |
|||||||||||
|
-Basic |
7,503,881 |
16,816,597 |
4,359,423 |
15,940,369 |
|||||||
|
-Diluted |
7,503,881 |
21,366,486 |
4,359,423 |
18,304,134 |
|||||||
Imperial Petroleum Inc.
Unaudited Consolidated Balance Sheets
(Expressed in United States Dollars)
|
December 31, |
June 30, |
||||||
|
2022 |
2023 |
||||||
|
Assets |
|||||||
|
Current assets |
|||||||
|
Cash and cash equivalents |
50,901,092 |
36,713,632 |
|||||
|
Time deposits |
68,000,000 |
61,912,900 |
|||||
|
Restricted cash |
1,005,827 |
-- |
|||||
|
Receivables from related party |
146,708 |
-- |
|||||
|
Trade and other receivables |
7,898,103 |
10,381,724 |
|||||
|
Other current assets |
240,002 |
376,132 |
|||||
|
Inventories |
5,507,423 |
7,444,975 |
|||||
|
Advances and prepayments |
172,908 |
353,209 |
|||||
|
Total current assets |
133,872,063 |
|
117,182,572 |
||||
|
Non current assets |
|||||||
|
Operating lease right-of-use asset |
-- |
31,349 |
|||||
|
Vessels, net |
226,351,081 |
216,771,929 |
|||||
|
Restricted cash |
5,600,000 |
-- |
|||||
|
Investment in related party |
-- |
12,656,833 |
|||||
|
Total non current assets |
231,951,081 |
229,460,111 |
|||||
|
Total assets |
365,823,144 |
346,642,683 |
|||||
|
Liabilities and Stockholders' Equity |
|||||||
|
Current liabilities |
|||||||
|
|
Trade accounts payable |
8,115,462 |
8,121,803 |
||||
|
Payable to related parties |
3,016,438 |
491,456 |
|||||
|
Accrued liabilities |
1,982,306 |
2,645,608 |
|||||
|
Operating lease liabilities |
-- |
31,349 |
|||||
|
Deferred income |
1,089,959 |
172,953 |
|||||
|
Current portion of long-term debt |
10,176,538 |
-- |
|||||
|
Total current liabilities |
24,380,703 |
11,463,169 |
|||||
|
Non current liabilities |
|||||||
|
Long-term debt |
59,787,923 |
-- |
|||||
|
Total non current liabilities |
59,787,923 |
|
-- |
||||
|
Total liabilities |
84,168,626 |
11,463,169 |
|||||
|
Commitments and contingencies |
|||||||
|
Mezzanine equity |
|||||||
|
|
Preferred stock, Series C |
-- |
10,000,000 |
||||
|
Total mezzanine equity |
|
|
-- |
|
10,000,000 |
||
|
Stockholders' equity |
|||||||
|
Capital stock |
129,724 |
170,874 |
|||||
|
Preferred Stock, Series A |
7,959 |
7,959 |
|||||
|
Preferred Stock, Series B |
160 |
160 |
|||||
|
Additional paid-in capital |
252,912,550 |
244,901,303 |
|||||
|
Retained earnings |
28,604,125 |
80,099,218 |
|||||
|
Total stockholders' equity |
|
|
281,654,518 |
|
325,179,514 |
||
|
Total liabilities, mezzanine equity and stockholders' equity |
|
365,823,144 |
|
346,642,683 |
|||
Imperial Petroleum Inc.
Unaudited Consolidated Statements of Cash Flows
(Expressed in United States Dollars
|
Six Month Periods Ended June 30, |
|||||||
|
2022 |
2023 |
||||||
|
Cash flows from operating activities |
|||||||
|
Net income for the period |
304,101 |
52,550,587 |
|||||
|
Adjustments to reconcile net income to net cash |
|||||||
|
provided by operating activities: |
|||||||
|
Depreciation |
4,902,831 |
8,690,061 |
|||||
|
Amortization of deferred finance charges |
29,470 |
474,039 |
|||||
|
Amortization of operating lease right-of-use asset |
-- |
31,349 |
|||||
|
Share based compensation |
-- |
1,091,189 |
|||||
|
Impairment loss |
-- |
8,996,023 |
|||||
|
Dividend income from related party |
-- |
(20,833) |
|||||
|
Changes in operating assets and liabilities: |
|||||||
|
(Increase)/decrease in |
|||||||
|
Trade and other receivables |
(2,172,381) |
(3,360,823) |
|||||
|
Other current assets |
(581,331) |
(136,130) |
|||||
|
Inventories |
(4,676,485) |
(2,062,365) |
|||||
|
Changes in operating lease liabilities |
-- |
(31,349) |
|||||
|
Advances and prepayments |
(393,340) |
(373,262) |
|||||
|
Increase/(decrease) in |
|||||||
|
Trade accounts payable |
4,288,624 |
500,001 |
|||||
|
Balances with related parties |
(745,505) |
(2,752,024) |
|||||
|
Accrued liabilities |
606,679 |
1,020,949 |
|||||
|
Deferred income |
(291,822) |
(801,066) |
|||||
|
Net cash provided by operating activities |
1,270,841 |
63, 816,346 |
|||||
|
Cash flows from investing activities |
|||||||
|
Acquisition and improvement of vessels |
(79,022,533) |
(26,284,405) |
|||||
|
Increase in bank time deposits |
-- |
(61,912,900) |
|||||
|
Maturity of bank time deposits |
-- |
68,000,000 |
|||||
|
Net cash used in investing activities |
(79,022,533) |
|
(20,197,305) |
||||
|
Cash flows from financing activities |
|||||||
|
Proceeds from equity offerings |
167,572,515 |
12,095,253 |
|||||
|
Stock issuance costs |
(10,767,944) |
(198,587) |
|||||
|
Dividends paid on preferred shares |
(870,492) |
(870,494) |
|||||
|
Loan repayments |
(2,402,000) |
(70,438,500) |
|||||
|
Cash retained by C3is Inc. at spin-off |
-- |
(5,000,000) |
|||||
|
Net cash provided by/(used in) financing activities |
153,532,079 |
|
(64,412,328) |
||||
|
Net increase/(decrease) in cash, cash equivalents and restricted cash |
75,780,387 |
(20,793,287) |
|||||
|
Cash, cash equivalents and restricted cash at beginning of year |
6,341,059 |
57,506,919 |
|||||
|
Cash, cash equivalents and restricted cash at end of period |
82,121,446 |
|
36,713,632 |
||||
|
Cash breakdown |
|||||||
|
Cash and cash equivalents |
79,135,753 |
36,713,632 |
|||||
|
Restricted cash, current |
485,693 |
-- |
|||||
|
Restricted cash, non current |
2,500,000 |
-- |
|||||
|
Total cash, cash equivalents and restricted cash shown in the statements of cash flows |
82,121,446 |
36,713,632 |
|||||
|
Supplemental Cash Flow Information |
||||||||
|
Interest paid |
305,349 |
1,735,054 |
||||||
|
Non-cash investing activity - Vessels’ improvements included in liabilities |
51,580 |
322,527 |
||||||
|
Non-cash financing activity – Dividends declared on Preferred Shares Series C included in Balances with related parties |
- |
185,000 |
||||||
|
Distribution of net assets of C3is Inc. to shareholders and warrantholders |
- |
20,957,952 |
||||||
[1] EBITDA, Adjusted EBITDA, Adjusted Net Income and Adjusted EPS are non-GAAP measures. Refer to the reconciliation of these measures to the most directly comparable financial measure in accordance with GAAP set forth later in this release.
[2] Adjusted retroactively to reflect the 1-for-15 reverse stock split effected on April 28, 2023.
Hafnia Orders Dual-Fuel Methanol Chemical IMOII MR Newbuilds
Together with Joint-Venture partner “Socatra of France”, Hafnia has concluded an order for four 49,800 deadweight dual-fuel Methanol Chemical IMOII Medium-Range (MR) Newbuilds, constructed out of Guangzhou Shipyard International (GSI), in China.
In line with Hafnia’s sustainability values and ambitions in transitioning towards a greener future and maritime sector, this is Hafnia’s first investment and step into the dual-fuel methanol landscape. In 2023, Hafnia took delivery of two of its four Liquified Natural Gas (LNG) dual-fuel LR2 Product Tankers – the Hafnia Languedoc and Hafnia Loire, also built out of GSI, with the two remaining vessels to be delivered up to 2024. The Hafnia Languedoc and Hafnia Loire are both on a Time-Charter agreement to TotalEnergies.
The increasing momentum in green methanol-fueled vessels highlights its ability as a cleaner marine fuel, with a future-proofed and proven net-zero pathway, furthering Hafnia’s ambitions in meeting the IMO’s 2050 targets.
The use of green methanol onboard eliminates local pollutants, including SOx and Particulate Matter (PM), cuts NOx emissions by 60%, and reduces CO2 emissions by close to 100% on a tank-to-wake basis versus conventional marine fuels.
Three of these four vessels will be delivered in 2025, with the fourth delivered in 2026. All four vessels are fixed via Time-Charter to TotalEnergies shipping entity CSSA for a multi-year period.
On confirming this new order, Søren Steenberg Jensen – Head of Asset Management says, “Given the time it takes to build a vessel and the time it takes actually to start moving the needle on carbon emissions, it is important to act now and take proactive steps in decarbonizing the maritime industry.” Søren states “It does, however, require partnerships with Charterers, to make the financials work. The cost of the new fuels’ technologies, if unsupported by long-term contracts, will have most owners refrain from taking the financial risk of the future fuel’s technology alone on otherwise already expensive assets.” He continues “We are very proud to be partnering with long-standing customer TotalEnergies, who are very committed in actively driving this transition with us.”
This deal marks the second time Hafnia partners with TotalEnergies in taking joint steps to develop low-carbon shipping solutions.
Jerome Cousin, Senior Vice President of Shipping at TotalEnergies, says, “As the IMO just decided new ambitious targets to decarbonize shipping, TotalEnergies is mobilized to enable the development of low carbon shipping. The dual-fuel methanol propulsion of the chartered MR tankers will offer highly valuable fuel flexibility and the actual capability for TotalEnergies to steer the decarbonization of its shipping activity, in line with the Company’s ambition. We are also very pleased to expand the relationship with Hafnia, and its French partner Socatra to benefit from their expertise and deliver safe, low carbon, and efficient shipping services.”
Fondo Italiano d’Investimento enters agreement to acquire a minority stake in RINA S.p.A.
Registro Italiano Navale, Fondo Italiano d’Investimento and RINA S.p.A have announced a new agreement aimed to allow the Italian fund to become a shareholder in RINA S.p.A., a multinational company based in Genoa, Italy.
The deal is expected to be completed in the autumn of 2023 and will involve an injection of up to 180 million euros in capital in the form of equity. After the deal’s completion, the ownership structure will see Registro Italiano Navale maintaining the majority stake, Fondo Italiano d’Investimento and other co-investors holding a minority stake of up to 33%, and the company's management participating with a 2.5% stake.
Fondo Italiano d’Investimento SGR will operate through an innovative structure that includes investments from Fondo Italiano Consolidamento e Crescita (FICC), Fondo Italiano Consolidamento e Crescita 2 (FICC 2), and, for the first time, a group of leading co-investors coordinated by Fondo Italiano. This transaction marks the first investment made by FICC 2, the second edition of the fund dedicated to supporting the growth and consolidation of Italian companies, which on this occasion also carried out, just one month after its launch, a first closing for a total of 245 million euro with cornerstone investors CDP Equity, Fondazione ENPAM, Intesa Sanpaolo, UniCredit, and other leading investors.
The capital injected by Fondo Italiano into the multinational based in Genoa, RINA S.p.A., is aimed at providing additional support for the company's growth, both organically and inorganically, as well as its international expansion. RINA S.p.A. has diversified significantly worldwide over the last twenty years, establishing itself as a brand in the fields of engineering consulting and Testing, Inspection & Certification (TIC).
In 2022, RINA S.p.A. reported pro-forma revenues of over 700 million euros, and it is on track to achieve growth objectives of nearly 800 million euros in 2023.

The Chairman and CEO of RINA S.p.A., Ugo Salerno, commented: “We have found the most suitable partner in Fondo Italiano d’Investimento to share our growth path and the realization of ambitious goals we have worldwide. It is a high-level institutional partner, Italian like us, with whom we will embark on a new phase for RINA and who will allow us to fully implement our strategic plan. Based on ESG principles, we will continue to expand our digital services and processes in favour of ecological transition: a journey that involves significant investments, made possible also thanks to the commitment of Fondo Italiano d'Investimento”.
Davide Bertone, CEO of Fondo Italiano d’Investimento, said: “Today, we announce the first closing and, at the same time, the first investment of the second edition of FICC, our flagship fund dedicated to promoting the development of national and global champions in strategic sectors of the Made in Italy. RINA represents Italian excellence, with a global presence, and leadership, as well as significant ambitions for further growth and innovation not only in the shipping sector but also in the energy transition and infrastructure sectors. I am extremely pleased with the partnership we are entering into today and the trust given to us by Registro Italiano Navale and Engineer Ugo Salerno, with whom we are delighted to collaborate in building another phase of development”.
To facilitate this agreement, RINA S.p.A. was advised by Lazard as the financial advisor, Banca Akros as the co-financial advisor, and PwC for financial Due Diligence and Studio Legale Gattai, Minoli, Partners as legal advisor.
On the other hand, Fondo Italiano d’Investimento was supported by BCG for business due diligence, Legance for legal due diligence, New Deal Advisors for financial due diligence, KPMG for tax due diligence, ERM for ESG due diligence, Marsh for insurance due diligence, and E&Y Parthenon for tech due diligence.
The completion of the transaction is subject to customary conditions, including regulatory approvals.
RINA S.p.A. is the first Italian certification and engineering company, providing a wide range of services in the Energy, Marine, Certification, Real Estate, Infrastructure, Mobility, and Industry sectors. With revenues reaching 664 million euros in 2022, the company operates in 70 countries with 5,300 employees and 200 offices worldwide.
Registro Italiano Navale, the majority shareholder of RINA S.p.A., is a private non-profit organization whose mission is to contribute to the safeguarding of human life, property, and the environment for the collective interest. Its Board of Directors includes representatives of the key categories connected with the undertaking and with its subsidiaries.
Fondo Italiano d’Investimento SGR was established in 2010 with the initiative of the Italian Ministry of Economy and Finance (MEF) and is participated by CDP Equity, Intesa Sanpaolo, UniCredit, Fondazione ENPAM, Fondazione ENPAIA, ABI, Banco BPM, and BPER Banca. The fund's main objective is to manage closed-end investment funds dedicated to channelling capital to excellent Italian companies, combining return on investment goals in line with international benchmarks and supporting the development of the Italian production system. Fondo Italiano manages 16 closed-end investment funds reserved for qualified investors, with assets of over 3 billion euros, and operates through both direct and indirect investments (fund of funds). The fund considers sustainability as a fundamental value and is committed to integrating environmental, social, and governance (ESG) criteria into its investment activities.
MSC joins SEA-LNG as latest coalition member
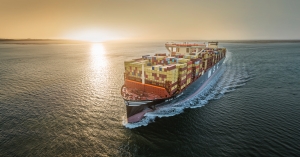
Global container shipping leader joins coalition to support cross-industry collaboration and accelerate use of net zero fuels at scale
LONDON, UK / GENEVA, SWITZERLAND [3 AUGUST 2023]: SEA-LNG, the multi-sector industry coalition established to demonstrate the benefits of the LNG pathway as a route to shipping’s decarbonisation, today welcomes MSC Mediterranean Shipping Company, the world-leading shipping company, as its latest member.
In recent years, MSC Mediterranean Shipping Company has made investments in LNG-fuelled vessels in the different sectors it operates within. In 2022 MSC saw its first five newbuilding dual-fuel LNG capable container vessels in operation. MSC is committed to maintaining a modern fleet that will advance progress towards net zero decarbonisation by replacing conventional fuel vessels with dual-fuel capable vessels in the short term, including those fuelled by LNG. In the cruise sector, the company has launched MSC World Europa and MSC Euribia, whose maiden voyage was powered by bio-LNG.
Bud Darr, Executive Vice President, Maritime Policy & Government Affairs MSC Group, said: “We are committed to catalyzing the development, accessibility and uptake of net zero fuels and believe we have found another excellent partner to help continue to drive the industry in this direction. We look forward to working with SEA-LNG to further assess and collaborate on the exciting long-term prospects of bio-LNG, and particularly renewable synthetic LNG, as mainstream marine fuel molecules.
“In alignment with our net zero commitments by 2050, we view fossil-based LNG as a fuel in transition, and fully expect bio and renewable synthetic LNG to be a key part of our longer-term multi-fuel strategy for deploying net zero fuels.”
As the world’s largest ocean carrier, MSC endeavours to be a steward of the world’s oceans and has invested substantially in ship design, cutting-edge technologies and digital applications to improve energy efficiency. The company continues to focus on improving energy efficiency and is taking actions today to properly support meeting its target of complete net decarbonisation by 2050.
MSC is actively exploring a range of alternative fuels and propulsion solutions that will help the business move even closer towards net zero, and the vessel operator sees cross-industry collaboration as crucial to scaling these solutions for the maritime industry. MSC expects to operate its vessels on a range of fuel options in the future, particularly looking at those that might become available at scale within a small number of years. MSC is also an active partner and member of the Methane Abatement in Maritime Innovation Initiative (MAMII) and the Society for Gas as a Marine Fuel (SGMF).
Peter Keller, Chairman of SEA-LNG, commented: "As one of the world's leading shipping companies, MSC's decision to work with our coalition of companies across the LNG value chain demonstrates its confidence in the LNG pathway as a viable solution for flexibly advancing shipping along its decarbonization journey.”
Keller further emphasised the advantages of LNG, stating: “LNG is available at scale for deep sea shipping today. Existing LNG infrastructure can accommodate bio-LNG and renewable synthetic LNG as they become increasingly accessible, lowering investment barriers. Waiting is not an option; the LNG pathway offers immediate decarbonization benefits and a route to net-zero shipping.”
The SEA-LNG coalition spans the entire shipping value chain and remains committed to sharing and developing credible, fact-based analysis of the LNG pathway.
About SEA-LNG
SEA-LNG is a UK-registered not-for-profit collaborative industry foundation serving the needs of its member organisations committed to furthering the use of LNG as an important, environmentally superior maritime fuel. SEA-LNG has members across the entire LNG value chain including providers of the product, users, engine and asset suppliers, and class societies. SEA-LNG is already recognised as an international leader in LNG matters. Each member organisation commits mutually agreed human resources, data analysis and knowledge sharing in support of SEA-LNG initiatives and activities and financially contributes via a membership fee. SEA-LNG is guided by a board, which is led by chairman Peter Keller, who was elected as Founding Chairman in 2016.
About MSC
MSC Mediterranean Shipping Company, headquartered in Geneva, Switzerland, is a global leader in transportation and logistics, privately owned and founded in 1970 by Gianluigi Aponte. As one of the world’s leading container shipping lines, MSC has 675 offices across 155 countries worldwide, with the MSC Group employing over 180,000 people. With access to an integrated network of road, rail and sea transport resources which stretches across the globe, the company prides itself on delivering global service with local knowledge. MSC’s shipping line sails on more than 260 trade routes, calling at 520 ports, and is targeting net zero decarbonization by 2050.
PPA S.A.: Held Ordinary General Meeting of Shareholders Approval of a dividend distribution of 1.04 euros per share, increased by 66%

PPA S.A. is pleased to announce the successful completion of today’s (2 August 2023) Ordinary General Meeting of Shareholders, conducted through a teleconference, in accordance with the prescribed procedure and with a quorum of 79.99%.
During the General Meeting the Shareholders were informed about the company’s progress and current developments, while they expressed their satisfaction with the company’s remarkable financial performance of the previous year.
It is noted that all items on the agenda were approved by a majority vote, including the Annual Financial Statements and the Dividend Distribution to the company’s shareholders for the fiscal year 2022 (from 01.01.2022 to 31.12.2022). The dividend amount, following the proposal by the Board of Directors, amounted to 1.04 euros per share, representing 65.6% increase compared to 2021.
It should be noted that the key figures of the Annual Financial Report for the year 2022 relate to the company turnover, which amounted to 194.6 million euros, indicating an increase of 26.2%. Profits before taxes amounted to €74.7 million showing an increase of 51.7%. Profits after taxes amounted to €52.9 million, indicating an increase of 43.9% and the cash reserves recording an increase, reaching 171.5 million euros.
PPA S.A. Chairman Mr. Yu Zenggang who presided over the General Meeting of Shareholders expressed sincere thanks to the shareholders for their trust and recognized the company management and employees for their unwavering commitment and dedication. He highlighted “the historic high performance of the previous year demonstrates the effectiveness of our value driven strategy for all stakeholders. We are committed to pursuing our systematic efforts in this direction, guided by our well-defined plans and strategy for a greener and more sustainable future, while continuously supporting and serving the society”.
About PPA S.A.
Piraeus Port Authority S.A. is an Athens Stock Exchange listed company engaged in the management and operation of Piraeus port, Greece’s largest port and one of the largest integrated harbours in Europe, providing a complete range of services. Some of the company’s activities involve cruise, coastal (ferry/passenger), container and car terminal services, as well as ship repair, logistics and free zone services. The main shareholder of Piraeus Port Authority S.A., with a stake of 67 percent, is COSCO SHIPPING, one of the largest maritime companies in the world.
Over the last decade the company has experienced a remarkable growth in all port activities, which is still underway, largely contributing to the country’s economy, while driven by green development and increased digitalization, alongside a people-first approach and a spirit of giving back to the society.
PPA holds the ''EcoPort'' PERS status, is included in the Athens Stock Exchange ESG index and is one of the “Most Sustainable Companies in Greece 2022”.
For more information please visit: https://olp.gr
The "Maritime Cyprus" Conference
About
The next “Maritime Cyprus” Conference is scheduled to take place in Limassol, between 8th and 11th October 2023. The Maritime Cyprus Conference is an established biennial event organised by the Shipping Deputy Ministry in cooperation with the Cyprus Shipping Chamber and the Cyprus Union of Shipowners and has grown into one of the world’s most significant shipping conferences since it was first organized back in 1989.
The Conference brings together more than 1000 participants, including shipowners, shipping executives, regulators and state officials from all over the world, including high-calibre speakers. Maritime Cyprus provides the opportunity to the participants to become familiar with the strong maritime tradition of Cyprus and the buzzing maritime cluster in cosmopolitan Limassol. Our endeavour is for Cyprus to maintain and enhance its role as an advanced, proactive, competitive maritime nation with a positive contribution both in Europe and internationally.
The main theme of this year’s Conference is “Shipping in Action: An Agenda for Change”.
The panel discussions included in this year’s programme, with the participation of high profile invited shipping specialists, will be discussing the main challenges shipping faces today:
• Sustainable Shipping towards 2050: a Mission (Im)Possible?
• The Shipowners’ perspective on the future of EU shipping
• Challenge Accepted: Energy Transition – Where do we Stand?
• The Role of Shipbuilding in an Evolving Shipping Industry
• Navigating the Seas of Capital: Exploring Ship Finance
• Digital Transformation and current developments
The Official Opening of the Conference will take place on Sunday, 8th October 2023. During the Opening Reception, the winner of the “Cyprus Maritime Award 2023” will be announced by H.E. the President of the Republic of Cyprus.
The main conference will be held, between 9th and 11th October 2023. The Official Opening of the working part will take place on Monday, 9th October 2023, by H.E. the President of the Republic of Cyprus.
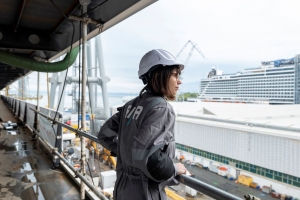
Marine Interiors Cruise & Ferry Global Expo
The Marine Interiors Cruise & Ferry Global Expo, organised by SMM, will return to Hamburg, Germany, this September. Exhibitors from all areas of ship interior design are expected to attend.
Launched in 2019 as the first stand-alone business-to-business trade fair for interior design, equipment and technologies for passenger ships, the show takes place every two years and runs in parallel with the Seatrade Europe – Cruise and River Cruise Convention.
Attendees will have the opportunity to meet top-level visitors including decision-makers from ship-owning companies, shipyards and design firms. There will also be a number of networking events and conference sessions featuring top-ranking experts who will discuss key industry topics.
Registration is open now.
![]()
Powered by ![]() © Μaritimes 2019
© Μaritimes 2019