-
Home

-
Maritimes NEWS
-
Ports
- maritimes

maritimes
London International Shipping Week
London International Shipping Week 2023, taking place throughout the week of 11th September 2023, is the ‘must attend’ event of 2023.
It will offer over 200 industry functions throughout various locations in London and the UK with unique networking opportunities for leaders across all sectors of the international shipping industry – regulators, charterers, ship owners, ship managers, bunker suppliers, lawyers, ship brokers, bankers, insurers, insurance brokers, commodity traders and brokers, ship suppliers, port operators, shipping service providers and many more. The week will attract the very highest-level government and shipping industry leaders from the UK and around the world.
One of the highlights of LISW23 is sure to be the Headline Conference on Wednesday 13th September whose central theme is Reframing Risk in a complex Marketplace. Chaired by LISW veteran Paddy Rodgers, the conference will feature leaders from throughout the shipping industry alongside prominent international business professionals. Topics to be discussed include achieving net zero and how shipping can meet and exceed its environmental, social and governance targets.
The glittering Gala Dinner, to be held for the first time beside the River Thames at ‘Evolution London’, will crown what promises to be another amazing week for maritime in particular and London in general.
Globus Maritime Limited Signs New Building Agreements for the Acquisition of Two Fuel-Efficient 64,000-DWT Motor Bulk Carriers

Glyfada, Greece, August 23, 2023. Globus Maritime Limited ("Globus," the “Company," “we,” or “our”), (NASDAQ: GLBS), a dry bulk shipping company, announced today that it has signed two contracts, through its wholly owned subsidiaries, for the construction and purchase of two fuel-efficient bulk carriers of about 64,000 DWT. The vessels will be built at a reputable shipyard in Japan and are scheduled to be delivered during the second half of 2026. The total consideration for the construction of the vessel is approximately $75.5 million, including various extras. The Company intends to finance with a combination of debt and equity.
Athanasios Feidakis President and CEO of Globus commented:
“We are pleased to announce the ordering of our fourth and fifth Ultramax newbuildings from a reputable shipbuilder. We remain consistent in our commitment in renewing our fleet with modern and fuelefficient vessels. Our efforts in enhancing shareholders value and growing our fleet continue to be firm.”
About Globus Maritime Limited
Globus is an integrated dry bulk shipping company that provides marine transportation services worldwide and presently owns, operates and manages a fleet of eight dry bulk vessels that transport iron ore, coal, grain, steel products, cement, alumina and other dry bulk cargoes internationally. Globus’ subsidiaries own and operate eight vessels with a total carrying capacity of 567,467 DWT and a weighted average age of 11.2 years as of June 30, 2023.
Four new partners join the Silk Alliance Singapore green corridor cluster initiative

The Silk Alliance continues to grow with the addition of Yara Clean Ammonia ASA, the Methanol Institute, MPC Container Ships ASA and the NUS Centre for Maritime Studies.
Following the signing of a Memorandum of Understanding (MoU) between the Maritime and Port Authority of Singapore (MPA) and Lloyd’s Register (LR) Maritime Decarbonisation Hub for the Silk Alliance, four additional members have joined the initiative – energy producer, Yara Clean Ammonia ASA; trade association, the Methanol Institute; academic institute, the National University of Singapore (NUS) Centre for Maritime Studies; and shipowner, MPC Container Ships ASA – to support the award-winning proposed project aimed at the decarbonisation of a regional shipping corridor centred on the container trades.
The Silk Alliance is focused on a regional fleet, predominantly bunkering in Singapore that also trades across the Indian and Pacific Oceans. The onboarding of Yara Clean Ammonia ASA and the Methanol Institute will accelerate efforts to better understand the fuel infrastructure considerations and bunkering capacity development required for zero-emission shipping.
The initiative will allow the fuel supply and fleet sides to overcome the chicken-or-egg dilemma in generating demand for low-to-zero carbon fuels. This ambition is further amplified with the inclusion of MPC Container Ships ASA, a leading container ship company specialising in serving intra-regional trade lanes, owning and operating one of the largest feeder fleets globally.
In addition, the academic partnership with the NUS Centre for Maritime Studies allows scope for further research work into technological solutions for the green corridor cluster, which complements ongoing scientific assessments of climate change risks undertaken by the Lloyd’s Register Foundation NUS Institute for Public Understanding of Risk.
Referencing the expanded Silk Alliance, Charles Haskell, Director of the LR Maritime Decarbonisation Hub, said: "The new Silk Alliance members can support the concerted effort of all our cross-industry partners with the aim of decarbonising the shipping corridor cluster in Singapore and the intra-Asia region. Through the implementation of the initiative, we aim for a spillover effect to the wider industry that will generate the momentum needed for shipping to fulfil its 2050 reduced emissions target."
Murali Srinivasan, Senior Vice President (Commercial) of Yara Clean Ammonia ASA, said: "Yara Clean Ammonia is pleased to be a new member of the Silk Alliance. Ammonia is one of the key potential alternative fuels identified to decarbonise the maritime industry. With our global footprint and safe track record in ammonia production, maritime logistics and trade, as well as the concurrent development of various low/zero-carbon ammonia production projects, Yara Clean Ammonia will engage closely with our partners and support the Silk Alliance in achieving its objectives."
Constantin Baack, CEO of MPC Container Ships, said: "As the world’s leading provider of intra-regional container tonnage with a strong foothold in intra-Asian trades we are pleased to join the Silk Alliance. Guided by our purpose to pursue conscious change in the container shipping industry, MPC Container Ships is dedicated to the advancement of decarbonisation of the maritime industry in close cooperation with customers and partners. The Silk Alliance is an ideal setting enabling the collaboration between industry experts to jointly tackle prevailing challenges and further develop the concept of green corridors."
Chris Chatterton, Chief Operating Officer, The Methanol Institute, said: "The Methanol Institute views the development of green corridors as critical to the maritime energy transition and we are looking forward to playing an active role in the Silk Alliance, helping stakeholders understand how they can adopt low carbon Methanol now and put themselves on a pathway to carbon neutrality, leveraging an existing supply chain and existing infrastructure."
Prof. Chew Ek Peng, Director of the NUS Centre for Maritime Studies, said: "Maritime decarbonisation is one of the main areas of focus of the NUS Centre for Maritime Studies. Joining as a new member of the Silk Alliance, we hope to contribute to the operationalisation of a green corridor in the intra-Asia region and support the maritime industry in achieving the 2050 reduced emission target."
About the Lloyd’s Register (LR) Maritime Decarbonisation Hub
The LR Maritime Decarbonisation Hub is a joint initiative between Lloyd’s Register Group and Lloyd’s Register Foundation. Our mission is to accelerate the sustainable decarbonisation of the maritime industry, by enabling the delivery and operation of safe, technically feasible and commercially viable zero-emission vessels by 2030 and beyond. We bring together thought leaders and subject matter experts with the skills, knowledge and capability to help the maritime industry design, develop and commercialise the pathways to future fuels required for decarbonisation.
For more information, go to www.maritimedecarbonisationhub.org
About Lloyd's Register (LR)
Trusted maritime advisers, partnering with clients to drive performance across the ocean economy.
Lloyd’s Register (LR) is a global professional services group specialising in marine engineering and technology. Created more than 260 years ago as the world’s first marine classification society, to improve and set standards for the safety of ships.
Today we are a leading provider of classification and compliance services to the marine and offshore industries, helping our clients design, construct and operate their assets to accepted levels of safety and environmental compliance.
We also provide advice, support and solutions on fleet performance and optimisation, voyage optimisation, enhancing our clients’ digital capability.
Our digital solutions are relied upon by more than 20,000 vessels. In the race to net zero, our research, technical expertise and industry-firsts are supporting a safe, sustainable maritime energy transition.
Lloyd’s Register Group is wholly owned by the Lloyd’s Register Foundation, a politically and financially independent global charity that promotes safety and education.
Greece and Italy employed most of the water transport workers in the EU
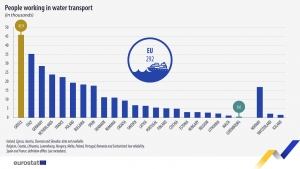
Among the EU countries, the largest number of people employed in water transport were recorded in Greece (45 900 people; 16% of total employment in water transport in the EU), followed by Italy (35 300; 12%) and Germany (28 600; 10%).
At the opposite end of the scale, the EU countries with the lowest numbers were Luxembourg (600; 0.2%), Malta (1 200; 0.4%) and Lithuania (2 300; 0.8%).
GAC expands operations in East Malaysia New Kota Kinabalu office to support Malaysia’s growing shipping, logistics and energy sectors
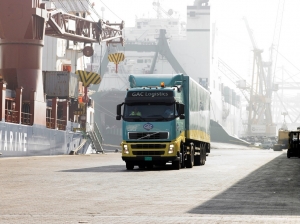
Kuala Lumpur, Malaysia, 24 August 2023: GAC Malaysia, a leading provider of shipping and logistics solutions in Southeast Asia, has opened a new office in Kota Kinabalu expanding its presence in the region to provide solutions to the evolving needs of the shipping and energy sectors.
The new office, GAC Malaysia’s 14th, will work in close cooperation with its Labuan office in the eastern state of Sabah and provide a wide range of shipping and logistics solutions, including ship agency, bunker fuels and husbandry services, as well as bespoke logistics, warehousing and distribution operations.
The opening of the Kota Kinabalu base follows the recent collaboration between Petronas Carigali (PCSB), a wholly-owned subsidiary of Malaysia’s state-owned energy giant Petronas, and the state government of Sabah over the operation of the Samarang offshore oil & gas (O&G) field.
The Samarang field, 50 km off the coast of Sabah, produces approximately 36,000 barrels of O&G equivalent per day and 134 million standard cubic feet per day of gas. The fuel is used to support the energy needs of customers in Kota Kinabalu and Labuan.
"Sabah is poised for major growth, most notably in its energy sector. This expansion will complement our operations in Labuan, fortify our presence in East Malaysia and enable us to be a critical part of the development in Sabah," says Herman Jorgensen, Managing Director of GAC Malaysia.
Daniel Nordberg, GAC’s Group Vice President, Asia Pacific & Indian Subcontinent, adds: “The new office in Kota Kinabalu is a testament of GAC’s commitment and confidence in the Malaysian market, where we have been providing services for almost 30 years. As a leading shipping and logistics service provider with an established foothold in Malaysia, GAC is well-placed to tap into the multitude of opportunities that Sabah presents.”
Future expansion in Malaysia
The Malaysian freight and logistics market is estimated to be worth USD26.35 billion in 2023 and is expected to reach USD35.10 billion by 2029, growing at a CAGR of 4.9% in that period, according to Indian market research firm Mordor Intelligence.
In a bid to support this forecast growth, GAC Malaysia has plans to open more offices in Kuantan and Yan on the Malaysian Peninsular.
“Malaysia’s shipping and logistics sector is on the rise, driven by rising demand from local manufacturing industries,” Herman adds. “We are looking to support the country’s growth by providing our industry-leading services to our customers using Malaysia’s ports and logistics hubs, both now and in future. GAC’s customer-service first and on-the-ground approach will ensure we are best placed to provide efficient and timely services to support shipping and logistics operations.”
About GAC Group
GAC is a global provider of integrated shipping, logistics and marine services. Emphasising world-class performance, a long-term approach, innovation, ethics and a strong human touch, GAC delivers a flexible and value-adding portfolio to help customers achieve their strategic goals.
Established since 1956, the privately-owned group employs over 7,500 people in more than 300 offices worldwide.
LR appoints Elina Papageorgiou as Vice President – Greece

Ongoing investments in Athens office reaffirm LR’s commitment to Greek owners, ensuring access to the right people, knowledge, and support.
Lloyd’s Register (LR) has further enhanced its capabilities in Greece and deepened its commitment to Greek clients, with the appointment of several additional global experts to its Athens office.
Leading the charge is Elina Papageorgiou, LR’s Global Strategic Growth Director, who has been named LR’s Greece Vice President. In addition to leading our business in Greece, Elina manages a dedicated global strategic growth team spread across key maritime hubs. She has a wealth of global experience, having spent 20 years at LR and across the industry in a variety of roles in several different worldwide locations. Elina returns to Greece after leading LR’s UK & Ireland business.
 As part of LR’s drive to deliver technical excellence across its global network, Theodosis Stamatellos will now become the Global Technical Client Care Director, a newly created role that will see him and his global team support clients with around the clock technical assistance and guidance.
Elina Papageorgiou, LR Greece Vice President, said: "I am delighted to be taking on this hugely important responsibility in Greece, especially at a time when the maritime industry is going through a fundamental transition. I am personally committed to strengthen relationships and connect our global capability to our local clients."
About Lloyd’s Register
Trusted maritime advisers, partnering with clients to drive performance across the ocean economy.
Lloyd’s Register (LR) is a global professional services group specialising in marine engineering and technology. Created more than 260 years ago as the world’s first marine classification society, to improve and set standards for the safety of ships.
Today we are a leading provider of classification and compliance services to the marine and offshore industries, helping our clients design, construct and operate their assets to accepted levels of safety and environmental compliance.
We also provide advice, support and solutions on fleet performance and optimisation, voyage optimisation, enhancing our clients’ digital capability. Our digital solutions are relied upon by more than 20,000 vessels.
In the race to zero emissions, our research, technical expertise and industry-firsts are supporting a safe, sustainable maritime energy transition.
Lloyd’s Register Group is wholly owned by the Lloyd’s Register Foundation, a politically and financially independent global charity that promotes safety and education.
For more information, go to www.lr.org
PCT: Expanding our capabilities
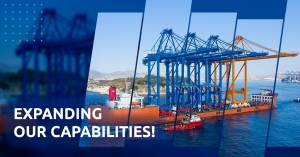
Along with the last Gantry #Cranes installed in August 2021, PCT operates 30 Gantry Cranes, 22 of which are of the latest generation and advanced technology, 19 of which are capable of serving vessels transporting more than 20,000 TEUs, as well as 22 RMGs and 45 ERTGs (container service bridges in the yard)
Greece is the largest shipowning nation in the world
Greece is the largest shipowning nation in the world as Greek shipowners control the highest share, 21%, of the global merchant fleet in terms of deadweight tonnes. During the last ten years the total capacity of the Greek merchant fleet, currently consisting of 5,520 ships, has grown by 50%.
The Greek-owned merchant fleet is the world’s largest cross-trader. It transports cargoes with more than 98% of its fleet capacity. Greek shipowners are mostly active in the bulk/tramp sector, which has features of an almost perfectly competitive market.
An average Greek-owned vessel is almost twice as big as the average vessel at global level. Greek shipowners do not only utilise significant economies of scale but they continue to invest heavily in new-build vessels and equipment of high environmental performance. They currently have 241 ships on order, corresponding to 19 million dwt, 40% higher than 2022.
Tap on the link to read the UGS Annual Report 2022-2023.
KR Publishes Research Report on Material Compatibility for Liquid Hydrogen Storage for Ships

22 August - Korean Register (KR) has announced the publication of a 'Research Report of Material Compatibility for Liquid Hydrogen Storage on Marine Application'. This report provides detailed technical information on materials suitable for on-board liquid hydrogen systems.
Following the recent resolutions at the IMO’s MEPC 80 meeting, where it was agreed upon to steer the shipping industry towards a net zero greenhouse gas emissions goal, countries are developing zero-carbon fuels and technologies for on-board use to meet their decarbonization targets.
Hydrogen stands out as one of the most promising alternative fuels. It is a carbon-free option that can also serve as a feedstock to produce alternative fuels, such as methanol. As international hydrogen transport and trade are becoming increasingly active, the demand for hydrogen carriers and hydrogen-fueled ships is expected to rise.
For safe and efficient storage and transport of hydrogen, it must be handled in its liquid state. This necessitates a cryogenic environment. However, until now, there has been a notable lack of research infrastructure and industry understanding of the materials used in marine liquid hydrogen storage systems.
To proactively respond to the future carbon-free fuel era, KR has been conducting the Korean Ministry of Oceans and Fisheries' Hydrogen Ship Safety Standard Development Project since 2020. In collaboration with Dr. Kim Yongjin's team at the Korea Institute of Machinery & Materials and Professor Kim Jeong-Hyeon's team at Pusan National University, KR has jointly established a 'Cryogenic Evaluation Infrastructure'.
The Cryogenic Evaluation Infrastructure is the only facility of its kind available in Korea. It is designed to test and analyze materials for alternative fuels that require cryogenic facilities, such as hydrogen. In this study, it was used to simulate the hydrogen environment by conducting mechanical evaluation test at -253℃, the storage temperature of liquid hydrogen.
This research report reflects the results of these tests and establishes evaluation methods for applied materials such as hydrogen pipes and tanks, as well as standards for applied materials.
KIM Daeheon, Executive Vice President of KR R&D Division, said:
"We believe that the results of this study will provide valuable guidance to industry, academia and research institutes researching and developing green ships and alternative fuels. KR will continue to support our customers and the maritime industry in various ways by developing new technologies and sharing the latest technical information to respond to environmental regulations".
The latest report is open to all interested parties and is available on KR’s website at www.krs.co.kr
Korean Register
Korean Register (KR) was established in 1960 with the purpose of promoting safety of life, property and the protection of the marine environment. KR currently classes an international fleet of 3,085 vessels totaling 81 million GT. It is headquartered in Busan, South Korea with a network of 80 offices around the world. KR is authorized to perform statutory and certification services in 79 countries around the world.
STEALTHGAS Inc. reports second quarter and six months 2023 financial and operating results

ATHENS, GREECE, August 18, 2023. STEALTHGAS INC. (NASDAQ: GASS), a ship-owning company serving the liquefied petroleum gas (LPG) sector of the international shipping industry, announced today its unaudited financial and operating results for the second quarter and six months ended June 30, 2023.
OPERATIONAL AND FINANCIAL HIGHLIGHTS
• All-time record Net Income of $27.3 million for the six-month period corresponding to a basic EPS of $0.71. Strong profitability continued for the second quarter with Net Income of $10.5 million for the three-month period corresponding to a basic EPS of $0.27.
• About 80% of fleet days are secured on period charters for the remainder of 2023, with total fleet employment days for all subsequent periods generating approximately $90 million (excl. JV vessels) in contracted revenues.
• Concluded the previously announced sale of the Eco Czar, the Eco Nemesis, the Eco Texiana and the Eco Enigma. All four vessels were sold at a profit, two were delivered during Q2 23’ and two during Q3 23’.
• Entered into an agreement to sell two more vessels, the Eco Dream and Eco Green with forward delivery in January 2024.
• Initiated a share repurchase program of up to $15 million. Up to August 11, 2023, 1.1 million shares had been repurchased.
• Massively reduced debt by $104.9 million from $245.4 million as of March 31, 2023, net of deferred finance charges, to $140.5 million as of June 30, 2023.
• Revenues at $36.7 million for Q2 23’ despite having reduced the number of vessels in the fleet from 34 vessels at the end of Q2 22’ to 29 vessels at the end of Q2 23’.
Six Months 2023 Results:
Revenues for the six months ended June 30, 2023, amounted to $74.7 million, a decrease of $0.4 million, or 0.5%, compared to revenues of $75.1 million for the six months ended June 30, 2022, primarily due to reduction in the fleet size.
Voyage expenses and vessels’ operating expenses for the six months ended June 30, 2023 were $7.5 million and $27.9 million, respectively, compared to $8.9 million and $26.2 million for the six months ended June 30, 2022. The $1.4 million decrease in voyage expenses was mainly due to the decrease in spot days and the lower prevailing bunker prices. The $1.7 million increase in vessels’ operating expenses despite the reduction in fleet size was primarily the result of cost overruns in certain cost categories like spares and crew and was more pronounced during the Q1 23’ and less so during Q2 23. Drydocking costs for the six months ended June 30, 2023 and 2022 were $2.6 million and $0.6 million, respectively. The costs for the six months ended June 30, 2023 mainly related to the completed drydocking of three of the larger handysize vessels, while the costs for the same period of last year related to the drydocking of one smaller vessel and to the drydocking preparation of three smaller vessels.
Depreciation for the six months ended June 30, 2023, was $12.6 million, a $1.5 million decrease from $14.1 million for the same period of last year, due to the decrease in the average number of our vessels.
Impairment loss for the six months ended June 30, 2023 was $2.8 million relating to two vessels, for which the Company has entered into separate agreements to sell them to third parties.
Impairment loss for the six months ended June 30, 2022 was $0.5 million relating to one vessel, for which the Company had entered into an agreement to sell and subsequently delivered to its new owner.
Gain on sale of vessels for the six months ended June 30, 2023 was $2.9 million, which was primarily due to the sale of two of the Company’s vessels.
Interest and finance costs for the six months ended June 30, 2023 and 2022 were $5.1 million and $5.1 million respectively. Despite increases in interest rates during that period interest rate costs remained flat due to the decrease of our indebtedness.
Equity earnings in joint ventures for the six months ended June 30, 2023 and 2022 was a gain of $10.5 million and a gain of $3.6 million, respectively. The $6.9 million increase from the same period of last year is mainly due to a gain on sale of one of the Medium Gas carriers owned by one of our joint ventures.
As a result of the above, the Company reported a net income for the six months ended June 30, 2023 of $27.3 million, compared to a net income of $19.8 million for the six months ended June 30, 2022. The weighted average number of shares outstanding as of June 30, 2023 and 2022 was 38.1 million and 37.9 million, respectively. Earnings per share, basic and diluted, for the six months ended June 30, 2023 amounted to $0.71 and $0.70, respectively compared to earnings per share, basic and diluted, of $0.52 for the same period of last year.
Adjusted net income was $28.0 million, or $0.74 per share, for the six months ended June 30, 2023 compared to adjusted net income of $20.0 million, or $0.53 per share, for the same period of last year.
EBITDA for the six months ended June 30, 2023 amounted to $43.1 million. Reconciliations of Adjusted Net Income, EBITDA and Adjusted EBITDA to Net Income are set forth below.
An average of 31.4 vessels were owned by the Company during the six months ended June 30, 2023, compared to 35.5 vessels for the same period of 2022.
As of June 30, 2023, cash and cash equivalents (incl. restricted) amounted to $55.2 million and total debt amounted to $140.5 million.
Fleet Update Since Previous Announcement
The Company announced the conclusion of the following chartering arrangements (of three or more months duration):
· A six months time charter for its 2011 built LPG carrier Gas Cerberus, until Dec 2023.
· A six months time charter extension for its 2015 built LPG carrier Eco Green, until Dec 2023.
As of August 2023, the Company has total contracted revenues of approximately $90 million.
For the remainder of the year 2023, the Company has about 80% of fleet days secured under period contracts, with contracted revenues of approximately $43 million.
During Q2 23’, the previously announced sale of Eco Texiana and Eco Enigma was concluded, resulting in a profit of $2.9 million from the sale, while during the current quarter the Eco Czar and Eco Nemesis were also delivered to their new owners and the profits will be reflected in Q3 23’.
The Company also announced the sale of two vessels, the 2015 built Eco Dream and Eco Green to third parties. The vessels were sold with forward deliveries as they are currently on charters, and the sales are expected to be concluded in January 2024. The Company recognized an impairment loss of $2.8 million, while the sale proceeds will be reflected in the cashflow results at the time of delivery. Both vessels are unencumbered.
CEO Harry Vafias Commented:
We continued operating in a firm market that underpinned yet another quarter of high profitability. So far for the first six months of 2023 we have reported the strongest performance on record, with an EPS of $0.71. During the second quarter we further divested assets in a rising market and will continue to diversify the fleet with the timely addition of bigger sized vessels. We were also largely focused on reducing debt, repaying $105million during the quarter alone, thus greatly reducing our interest rate expenses. At the same time our Board authorised us to repurchase shares that we started doing late in the previous quarter. Up to now we have repurchased over 1million common shares and will continue. We are at the fortunate position where we can deleverage, diversify, repurchase stock and maintain strong liquidity concurrently. Despite any seasonal fluctuations the market remains relatively firm and we expect and upturn in the winter months that are approaching. We remain positive for the medium-term outlook of the LPG shipping market.
Conference Call details:
On August 18, 2023 at 11:00 am ET, the company’s management will host a conference call to discuss the results and the company’s operations and outlook.
Conference call participants should pre-register using the below link to receive the dial-in numbers and a personal PIN, which are required to access the conference call.
Online Registration: https://register.vevent.com/register/BI05865c475c6741a6b32fe9d9e6b9ab20
Slides and audio webcast:
There will also be a live and then archived webcast of the conference call, through the STEALTHGAS INC. website (www.stealthgas.com). Participants to the live webcast should register on the website approximately 10 minutes prior to the start of the webcast.
About STEALTHGAS INC.
SteatlhGas Inc. is a ship-owning company serving the liquefied petroleum gas (LPG) sector of the international shipping industry. SteatlhGas Inc. has a fleet of 32 LPG carriers, including five Joint Venture vessels in the water, and three 40,000 cbm newbuilding Medium Gas Carriers (one owned through Joint Venture) to be delivered by the end of Q1 2024. These LPG vessels have a total capacity of 397,747 cubic meters (cbm). StealthGas Inc.’s shares are listed on the Nasdaq Global Select Market and trade under the symbol “GASS.”
Visit our website at www.stealthgas.com
Fleet Data:
The following key indicators highlight the Company’s operating performance during the periods ended June 30, 2022 and June 30, 2023.
|
FLEET DATA |
Q2 2022 |
Q2 2023 |
6M 2022 |
6M 2023 |
|
Average number of vessels (1) |
34.6 |
30.5 |
35.5 |
31.4 |
|
Period end number of owned vessels in fleet |
34 |
29 |
34 |
29 |
|
Total calendar days for fleet (2) |
3,147 |
2,774 |
6,431 |
5,677 |
|
Total voyage days for fleet (3) |
3,142 |
2,725 |
6,392 |
5,596 |
|
Fleet utilization (4) |
99.8% |
98.2% |
99.4% |
98.6% |
|
Total charter days for fleet (5) |
2,778 |
2,361 |
5,629 |
4,986 |
|
Total spot market days for fleet (6) |
364 |
364 |
763 |
610 |
|
Fleet operational utilization (7) |
96.9% |
95.6% |
94.8% |
96.4% |
1) Average number of vessels is the number of owned vessels that constituted our fleet for the relevant period, as measured by the sum of the number of days each vessel was a part of our fleet during the period divided by the number of calendar days in that period.
2) Total calendar days for fleet are the total days the vessels we operated were in our possession for the relevant period including off-hire days associated with major repairs, drydockings or special or intermediate surveys.
3) Total voyage days for fleet reflect the total days the vessels we operated were in our possession for the relevant period net of off-hire days associated with major repairs, drydockings or special or intermediate surveys.
4) Fleet utilization is the percentage of time that our vessels were available for revenue generating voyage days, and is determined by dividing voyage days by fleet calendar days for the relevant period.
5) Total charter days for fleet are the number of voyage days the vessels operated on time or bareboat charters for the relevant period.
6) Total spot market charter days for fleet are the number of voyage days the vessels operated on spot market charters for the relevant period.
7) Fleet operational utilization is the percentage of time that our vessels generated revenue, and is determined by dividing voyage days excluding commercially idle days by fleet calendar days for the relevant period.
Reconciliation of Adjusted Net Income, EBITDA, adjusted EBITDA and adjusted EPS:
Adjusted net income represents net income before loss/gain on derivatives excluding swap interest paid/received, impairment loss, net gain/loss on sale of vessels and share based compensation. EBITDA represents net income before interest and finance costs, interest income and depreciation. Adjusted EBITDA represents net income before interest and finance costs, interest income, depreciation, impairment loss, net gain/loss on sale of vessels, share based compensation and loss/gain on derivatives.
Adjusted EPS represents Adjusted net income divided by the weighted average number of shares. EBITDA, adjusted EBITDA, adjusted net income and adjusted EPS are not recognized measurements under U.S. GAAP. Our calculation of EBITDA, adjusted EBITDA, adjusted net income and adjusted EPS may not be comparable to that reported by other companies in the shipping or other industries. In evaluating Adjusted EBITDA, Adjusted net income and Adjusted EPS, you should be aware that in the future we may incur expenses that are the same as or similar to some of the adjustments in this presentation.
EBITDA, adjusted EBITDA, adjusted net income and adjusted EPS are included herein because they are a basis, upon which we and our investors assess our financial performance. They allow us to present our performance from period to period on a comparable basis and provide investors with a means of better evaluating and understanding our operating performance.
|
(Expressed in United States Dollars, |
Second Quarter Ended June 30th, |
Six Months Periods Ended June 30th, |
||
|
|
2022 |
2023 |
2022 |
2023 |
|
Net Income - Adjusted Net Income |
||||
|
Net income |
12,218,614 |
10,490,976 |
19,818,867 |
27,307,167 |
|
(Less)/Plus (gain)/loss on derivatives |
(1,049,015) |
(358,422) |
(1,065,802) |
(296,108) |
|
(Less)/Plus swap interest (paid)/received |
(81,581) |
195,969 |
(81,581) |
389,287 |
|
(Less)/Plus (gain)/loss on sale of vessels, net |
(569) |
(2,949,339) |
408,637 |
(2,925,985) |
|
Plus impairment loss |
-- |
2,759,554 |
529,532 |
2,816,873 |
|
Plus share based compensation |
188,722 |
552,932 |
439,731 |
728,501 |
|
Adjusted Net Income |
11,276,171 |
10,691,670 |
20,049,384 |
28,019,735 |
|
Net income - EBITDA |
||||
|
Net income |
12,218,614 |
10,490,976 |
19,818,867 |
27,307,167 |
|
Plus interest and finance costs |
2,757,529 |
2,508,108 |
5,119,033 |
5,130,794 |
|
Less interest income |
(63,488) |
(884,209) |
(71,378) |
(1,925,153) |
|
Plus depreciation |
7,031,345 |
6,013,651 |
14,052,128 |
12,592,017 |
|
EBITDA |
21,944,000 |
18,128,526 |
38,918,650 |
43,104,825 |
|
Net income - Adjusted EBITDA |
||||
|
Net income |
12,218,614 |
10,490,976 |
19,818,867 |
27,307,167 |
|
(Less)/Plus (gain)/loss on derivatives |
(1,049,015) |
(358,422) |
(1,065,802) |
(296,108) |
|
(Less)/Plus (gain)/loss on sale of vessels, net |
(569) |
(2,949,339) |
408,637 |
(2,925,985) |
|
Plus impairment loss |
-- |
2,759,554 |
529,532 |
2,816,873 |
|
Plus share based compensation |
188,722 |
552,932 |
439,731 |
728,501 |
|
Plus interest and finance costs |
2,757,529 |
2,508,108 |
5,119,033 |
5,130,794 |
|
Less interest income |
(63,488) |
(884,209) |
(71,378) |
(1,925,153) |
|
Plus depreciation |
7,031,345 |
6,013,651 |
14,052,128 |
12,592,017 |
|
Adjusted EBITDA |
21,083,138 |
18,133,251 |
39,230,748 |
43,428,106 |
|
EPS - Adjusted EPS |
||||
|
Net income |
12,218,614 |
10,490,976 |
19,818,867 |
27,307,167 |
|
Adjusted net income |
11,276,171 |
10,691,670 |
20,049,384 |
28,019,735 |
|
Weighted average number of shares |
37,924,542 |
38,096,414 |
37,891,672 |
38,063,544 |
|
EPS - Basic |
0.32 |
0.27 |
0.52 |
0.71 |
|
Adjusted EPS |
0.30 |
0.28 |
0.53 |
0.74 |
StealthGas Inc.
Unaudited Consolidated Statements of Income
(Expressed in United States Dollars, except for number of shares)
|
Quarters Ended June 30, |
|
Six Month Periods Ended June 30, |
|||||||||
|
2022 |
2023 |
|
2022 |
2023 |
|||||||
|
|
|||||||||||
|
Revenues |
|||||||||||
|
Revenues |
39,274,984 |
36,672,505 |
75,146,105 |
74,734,675 |
|||||||
|
Expenses |
|||||||||||
|
Voyage expenses |
4,161,806 |
3,081,142 |
7,953,019 |
6,599,833 |
|||||||
|
Voyage expenses - related party |
483,503 |
453,270 |
923,517 |
926,952 |
|||||||
|
Vessels' operating expenses |
13,056,966 |
13,124,829 |
25,698,196 |
27,413,610 |
|||||||
|
Vessels' operating expenses - related party |
278,000 |
246,500 |
514,950 |
504,000 |
|||||||
|
Drydocking costs |
193,090 |
1,461,559 |
576,625 |
2,551,601 |
|||||||
|
Management fees - related party |
1,287,765 |
1,176,881 |
2,572,685 |
2,411,001 |
|||||||
|
General and administrative expenses |
826,380 |
1,211,471 |
1,767,911 |
2,020,400 |
|||||||
|
Depreciation |
7,031,345 |
6,013,651 |
14,052,128 |
12,592,017 |
|||||||
|
Impairment loss |
-- |
2,759,554 |
529,532 |
2,816,873 |
|||||||
|
Net (gain)/loss on sale of vessels |
(569) |
(2,949,339) |
408,637 |
(2,925,985) |
|||||||
|
Total expenses |
27,318,286 |
|
26,579,518 |
|
54,997,200 |
|
54,910,302 |
||||
|
|
|
|
|
|
|
|
|
||||
|
Income from operations |
11,956,698 |
|
10,092,987 |
|
20,148,905 |
|
19,824,373 |
||||
|
Other (expenses)/income |
|||||||||||
|
Interest and finance costs |
(2,757,529) |
(2,508,108) |
(5,119,033) |
(5,130,794) |
|||||||
|
|
Gain on derivatives |
1,049,015 |
358,422 |
1,065,802 |
296,108 |
||||||
|
Interest income |
63,488 |
884,209 |
71,378 |
1,925,153 |
|||||||
|
Foreign exchange gain/(loss) |
12,688 |
(28,673) |
44,705 |
(132,999) |
|||||||
|
Other expenses, net |
(1,632,338) |
|
(1,294,150) |
|
(3,937,148) |
|
(3,042,532) |
||||
|
Income before equity in earnings of investees |
10,324,360 |
|
8,798,837 |
|
16,211,757 |
|
16,781,841 |
||||
|
Equity earnings in joint ventures |
1,894,254 |
|
1,692,139 |
3,607,110 |
|
10,525,326 |
|||||
|
Net Income |
12,218,614 |
|
10,490,976 |
|
19,818,867 |
|
27,307,167 |
||||
|
Earnings per share |
|||||||||||
|
- Basic |
0.32 |
0.27 |
0.52 |
0.71 |
|||||||
|
- Diluted |
0.32 |
0.27 |
0.52 |
0.70 |
|||||||
|
Weighted average number of shares |
|||||||||||
|
- Basic |
37,924,542 |
38,096,414 |
37,891,672 |
38,063,544 |
|||||||
|
- Diluted |
37,924,542 |
38,242,647 |
37,891,672 |
38,171,981 |
|||||||
StealthGas Inc.
Unaudited Consolidated Balance Sheets
(Expressed in United States Dollars)
|
December 31, |
|
June 30, |
||||||
|
2022 |
2023 |
|||||||
|
Assets |
||||||||
|
Current assets |
||||||||
|
Cash and cash equivalents |
55,770,823 |
48,105,094 |
||||||
|
Short term investments |
26,500,000 |
-- |
||||||
|
Trade and other receivables |
4,630,536 |
4,327,270 |
||||||
|
Other current assets |
270,514 |
178,070 |
||||||
|
Claims receivable |
182,141 |
55,475 |
||||||
|
Inventories |
3,064,011 |
2,190,731 |
||||||
|
Advances and prepayments |
681,413 |
2,212,508 |
||||||
|
Restricted cash |
2,519,601 |
866,942 |
||||||
|
Assets held for sale |
11,107,182 |
63,163,308 |
||||||
|
Total current assets |
104,726,221 |
|
121,099,398 |
|||||
|
Non current assets |
||||||||
|
Advances for vessel acquisitions |
23,400,000 |
23,400,000 |
||||||
|
Operating lease right-of-use assets |
-- |
147,872 |
||||||
|
Vessels, net |
628,478,453 |
515,411,960 |
||||||
|
Other receivables |
162,872 |
115,953 |
||||||
|
Restricted cash |
10,864,520 |
6,201,735 |
||||||
|
Investments in joint ventures |
46,632,720 |
37,880,047 |
||||||
|
Deferred finance charges |
165,666 |
936,833 |
||||||
|
Fair value of derivatives |
7,102,855 |
2,691,625 |
||||||
|
Total non current assets |
716,807,086 |
586,786,025 |
||||||
|
Total assets |
821,533,307 |
707,885,423 |
||||||
|
Liabilities and Stockholders' Equity |
||||||||
|
Current liabilities |
||||||||
|
|
Payable to related parties |
2,476,663 |
5,940,749 |
|||||
|
Trade accounts payable |
11,838,243 |
11,518,132 |
||||||
|
Accrued and other liabilities |
6,923,992 |
4,508,182 |
||||||
|
Operating lease liabilities |
-- |
97,198 |
||||||
|
Deferred income |
5,234,978 |
3,940,460 |
||||||
|
Current portion of long-term debt |
30,083,806 |
16,596,302 |
||||||
|
Current portion of long-term debt associated with vessel held for sale |
-- |
8,629,146 |
||||||
|
Total current liabilities |
56,557,682 |
51,230,169 |
||||||
|
Non current liabilities |
||||||||
|
|
Operating lease liabilities |
-- |
50,674 |
|||||
|
Deferred income |
21,451 |
108,818 |
||||||
|
Long-term debt |
247,028,823 |
115,272,799 |
||||||
|
Total non current liabilities |
247,050,274 |
|
115,432,291 |
|||||
|
Total liabilities |
303,607,956 |
166,662,460 |
||||||
|
Commitments and contingencies |
-- |
-- |
||||||
|
Stockholders' equity |
||||||||
|
Capital stock |
435,274 |
442,604 |
||||||
|
Treasury stock |
(25,373,380) |
(26,012,355) |
||||||
|
Additional paid-in capital |
443,620,122 |
444,341,293 |
||||||
|
Retained earnings |
94,056,852 |
121,364,019 |
||||||
|
Accumulated other comprehensive income |
5,186,483 |
1,087,402 |
||||||
|
Total stockholders' equity |
|
|
|
517,925,351 |
|
541,222,963 |
||
|
Total liabilities and stockholders' equity |
|
|
821,533,307 |
|
707,885,423 |
|||
StealthGas Inc.
Unaudited Consolidated Statements of Cash Flows
(Expressed in United States Dollars)
|
Six Month Periods Ended June 30, |
||||||||
|
|
2022 |
2023 |
||||||
|
|
||||||||
|
Cash flows from operating activities |
||||||||
|
Net income for the period |
19,818,867 |
27,307,167 |
||||||
|
Adjustments to reconcile net income to net cash |
||||||||
|
provided by operating activities: |
||||||||
|
Depreciation |
14,052,128 |
12,592,017 |
||||||
|
Amortization of deferred finance charges |
537,936 |
1,138,934 |
||||||
|
Amortization of operating lease right-of-use assets |
43,229 |
52,226 |
||||||
|
Share based compensation |
439,731 |
728,501 |
||||||
|
Change in fair value of derivatives |
(1,147,383) |
312,149 |
||||||
|
Equity earnings in joint ventures |
(3,607,110) |
(10,525,326) |
||||||
|
Dividends received from joint ventures |
1,020,000 |
14,589,215 |
||||||
|
Impairment loss |
529,532 |
2,816,873 |
||||||
|
Loss/(Gain) on sale of vessels |
408,637 |
(2,925,985) |
||||||
|
Changes in operating assets and liabilities: |
||||||||
|
|
(Increase)/decrease in |
|||||||
|
Trade and other receivables |
(828,992) |
350,185 |
||||||
|
Other current assets |
79,873 |
92,444 |
||||||
|
Claims receivable |
(500,249) |
-- |
||||||
|
Inventories |
(1,295,545) |
1,073,527 |
||||||
|
Changes in operating lease liabilities |
(43,229) |
(52,226) |
||||||
|
Advances and prepayments |
(1,379,236) |
(1,531,095) |
||||||
|
Increase/(decrease) in |
||||||||
|
Balances with related parties |
611,148 |
3,461,488 |
||||||
|
Trade accounts payable |
740,512 |
(248,382) |
||||||
|
Accrued liabilities |
2,282,746 |
(1,271,144) |
||||||
|
Deferred income |
(1,775,859) |
(1,207,151) |
||||||
|
Net cash provided by operating activities |
29,986,736 |
46,753,417 |
||||||
|
Cash flows from investing activities |
||||||||
|
Insurance proceeds |
206,787 |
126,666 |
||||||
|
Proceeds from sale of vessels, net |
23,887,379 |
47,187,215 |
||||||
|
Acquisition of vessels |
(447,713) |
(71,729) |
||||||
|
Maturity in short term investments |
-- |
26,500,000 |
||||||
|
Return of investments from joint ventures |
-- |
4,688,785 |
||||||
|
Net cash provided by investing activities |
23,646,453 |
|
78,430,937 |
|||||
|
Cash flows from financing activities |
||||||||
|
Stock repurchase |
-- |
(638,975) |
||||||
|
Deferred finance charges paid |
(534,600) |
(775,833) |
||||||
|
Advances from joint ventures |
1,655,684 |
2,698 |
||||||
|
Advances to joint ventures |
(1,450,334) |
(100) |
||||||
|
Loan repayments |
(68,176,450) |
(137,753,317) |
||||||
|
Proceeds from long-term debt |
59,400,000 |
-- |
||||||
|
Net cash used in financing activities |
(9,105,700) |
|
(139,165,527) |
|||||
|
Net increase/(decrease) in cash, cash equivalents and restricted cash |
44,527,489 |
(13,981,173) |
||||||
|
Cash, cash equivalents and restricted cash at beginning of year |
45,700,537 |
69,154,944 |
||||||
|
Cash, cash equivalents and restricted cash at end of period |
90,228,026 |
|
55,173,771 |
|||||
|
Cash breakdown |
||||||||
|
Cash and cash equivalents |
77,874,497 |
48,105,094 |
||||||
|
Restricted cash, current |
2,187,385 |
866,942 |
||||||
|
Restricted cash, non current |
10,166,144 |
6,201,735 |
||||||
|
Total cash, cash equivalents and restricted cash shown in the statements of cash flows |
90,228,026 |
55,173,771 |
||||||
![]()
Powered by ![]() © Μaritimes 2019
© Μaritimes 2019