

Cyber Security – Now!
 |
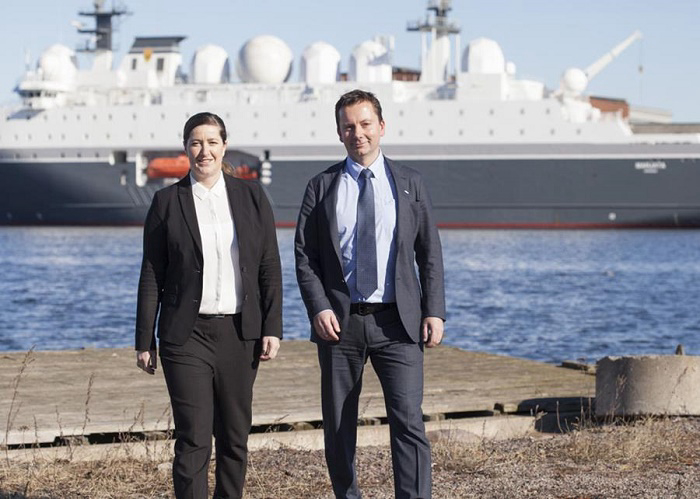
| Anita Oestmann, DNV GL and Roger Ringstad, Seagull Maritime. Photo T.Aas, Seagull Maritime 2017 |
With the increasing use of systems with embedded software on ships and mobile offshore platforms, cyber security is becoming critical not only for data protection, but also for reliable operations. According to Symantec Security Response, “You don’t need as many technical skills to find one person who might be willing, in a moment of weakness, to open up an attachment that contains malicious content.” 97\% of attacks actually consist of trying to trick a user using social engineering techniques.
Seagull Maritime has therefore implemented DNV GL’s e-learning modules on cyber security into their training system. “We are now offering a sought after e-learning course on this topic, helping crew and shore staff to raise awareness on this very important issue regarding cyber security,” says Roger Ringstad, Managing Director Seagull Maritime.
“We developed the modules because we quickly realized that the human factor is the greatest cyber-security risk. As crews were dispersed on ships, we needed an ‘anytime, anywhere‘ training solution to raise awareness,” says Volker Bertram, Senior Project Manager at DNV GL. He continues, “We then got some structure into our story, starting with maritime cases of cyber security breaches to demonstrate that it is an issue for our industry. Showing examples of ’what could be you‘ and highlighting the most common techniques to breach cyber security and finally outlining simple countermeasures to avoid breaches and limit the damage in case of breaches”.
The content of these e-learning modules will help raise awareness about threats and countermeasures, addressing your cyber security management system by encouraging the crew’s good cyber hygiene. The modules explain in simple steps how and where cyber-attacks may target not only your direct IT infrastructure, but also the embedded software in assorted operational technology (OT) systems on board. This easy-to-understand course is intended for a wider audience; the material also leverages key safety management practices and shows how they can be applied to cyber security within the maritime and offshore industries.
 |
The modules on Cyber Security from DNV-GL will be available through the Seagull Training System in our March product release.
DRYSHIPS Announces successful completion of the $200.0 million common stock offering
Following the completion of the offering, the Company has approximately 152,055,576 common shares outstanding.
Mr. George Economou, Chairman and CEO commented:
“We are very pleased to have successfully raised an additional $198 million of equity, which will increase our total available liquidity to about $455 million. We continue to look at opportunities to diversify and grow our fleet with high quality tonnage and significant operating leverage.”
About DryShips Inc.
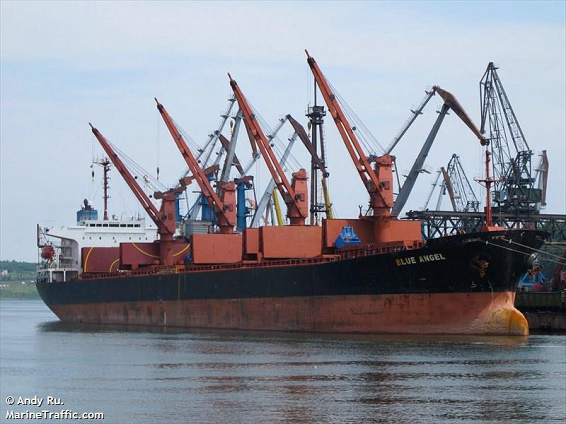
The Company is a diversified owner of ocean going cargo vessels that operate worldwide. The Company owns a fleet of (i) 13 Panamax drybulk carriers, which have a combined deadweight tonnage of approximately 1.0 million dwt, (ii) one Very Large Crude Carrier and one Aframax tanker newbuilding, each of which are expected to be delivered in the second quarter of 2017, (iii) 2 Very Large Gas Carrier newbuildings which are expected to be delivered in the second and third quarter of 2017, respectively, and (iv) six offshore support vessels, comprising two platform supply and four oil spill recovery vessels.
The Company’s common stock is listed on the NASDAQ Capital Market where it trades under the symbol “DRYS.”
DryShips Inc.
Capital Ship Management Corp. is Awarded the “Best Vessel Operator – Europe” Sea Transport Award 2017

About Capital Ship Management Corp.
Capital Ship Management Corp. (a subsidiary of Capital Maritime & Trading Corp.) is a distinguished oceangoing vessel operator, offering comprehensive services in every aspect of ship management, currently operating a fleet of 57 vessels with a total dwt of 6.06 million tons approx. The fleet under management includes the vessels of Nasdaq-listed Capital Product Partners L.P.
www.capitalship.gr
Are art and cultural involvement the matchmakers between your port and the city? Submit your project for the ESPO Award 2017!
The ESPO Award 2017 will go to the port that succeeds best in societal integration of the port with the city or wider community in which it is located, through involvement in art or culture. The ESPO Award jury will assess the level of engagement of the port, the innovative character of the involvement and/or cooperation and will look into the impact of this involvement in terms of bringing the port closer to the citizens and local community. The jury will not assess the artistic value of the project.
The ESPO Award was established in 2009 to promote innovative projects of port authorities that improve societal integration of ports, especially with the city or wider community in which they are located. In this way, the Award aims to stimulate the sustainable development of European ports and their cities.
Project submissions have to reach the ESPO secretariat by Friday 30 June 2017 at the latest.
The 9th ESPO Award will be officially handed out during an Award Ceremony and Port Night, which will take place on 8 November 2017 in Brussels.
Previous winners of the Award are the Port of Gijón (2009), the Port of Helsinki (2010), the Ports of Stockholm (2011), the Port of Genoa (2012), the Port of Antwerp (2013), the Port of Koper (2014), Port of Dublin (2015) and BremenPorts (2016).
The terms of reference and application form can be found here: Terms of Reference - Application Form.
RMI Registry has maintained its excellent reputation and as such has attracted quality owners
 |
“This process along with our service oriented philosophy has ensured the RMI Registry has maintained its excellent reputation and as such has attracted quality owners, including the Greek owners to the RMI flag,” he said. “We are delighted that our Greek owners and operators continue to hold the RMI Registry in such high regard which has been reflected in the Greek Shipping Co-operation Committee’s March 2017 Greek Controlled Shipping Report which shows the RMI as the number one choice of flag for Greek owners and operators,” he concluded.
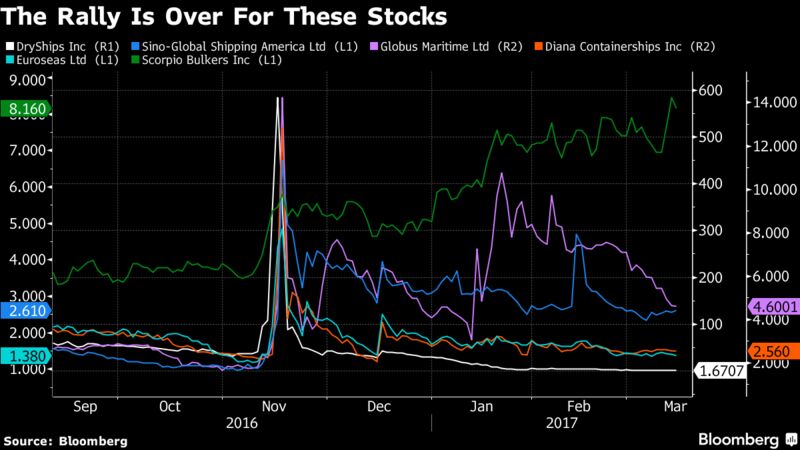
Shipping Stocks That Soared After the Election Have Now Tanked
However, analysts say that the hopes are fading, which is apparent in the subsequent decline in share prices.
“We had the initial gush that Trump was going to cure all the world’s economic problems,” Peter Boockvar, chief market analyst at The Lindsey Group, said in an interview. “Now reality is setting in that America first-type protectionism is not good for global growth.”
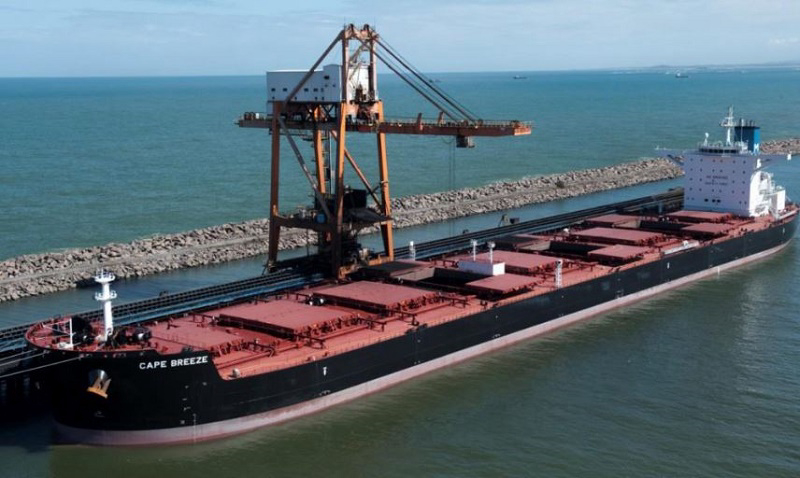
Dry Bulk Market: Capesize Market Poised to Enter New Heights says FIS
Momentum in the form of the stochastic also supports the current upward move, and at 49 it is close to confirming that it is in bullish territory. Recent upward moves have lasted as long as eight weeks (we are currently on week 5) suggesting that there is more to go in this current move. Importantly we have completed a 3 wave down and broken the lower high of the index at US$ 13,176 from the 6-1-17. Technically it looks as if we are starting a new bull cycle implying that index pullback from here should find buying support rather than longer term corrective formations.
The April futures continue to make fresh highs, with the 8 period Exponential moving average acting as support. At this point the trend is technically bullish. The stochastic is now starting to show a bearish divergence. This is not a sell signal, but it does suggest that upside momentum is starting to weaken, and market longs should look to tighten risk. The bearish momentum is also supported by the three impulse upward moves. Again not a sell signal, however three upward moves are often followed by market consolidation, or correction. Technically bullish, there are signs upside resistance levels could hold.
The daily chart for the Cal 18 futures has recently tested trend support. Broken briefly it is currently holding, maintaining bullish trending conditions. There is some cause of concern for the longer term trend at this point. The recent momentum pullback is making fresh lows compared to the rising trend (highlighted by the green circle). This signifies a weakening trend and is known as a stochastic bull trap, and implies that the current upward move is likely to be the last before the Cal 18 enters into a corrective phase. The trend is technically bullish, however the stochastic bull trap would suggest that upside moves could be limited from here. Remembering the longer term trend is bullish on the index, we expect a corrective phase rather than a market top.
The Q2 V Cal 18 futures spread is starting to look overextended. The spread is still walking the Bollinger band with the 8 EMA acting as a support. A US$ 4,500 move has resulted in spread showing a bearish divergence, warning that a corrective phase could be due soon. Shorter period EMA’s (not shown on this chart due to the noise) are also starting to fan out implying that a corrective move down could be upon us soon. Technically any market pullback remains in bullish territory above US$ – 1,207. Only a close below this level would suggest a bear move rather than a corrective move.
PANAMAX
A difficult chart to read on the Panamax index. The trend line held, and the index remains in bullish territory. Weekly momentum is showing a bullish cross from oversold territory. The upward move that started last year is not Elliot wave, as the middle wave is the shortest. The momentum pullback is lower than previous pullback, whilst the market is in an upward trend. This would suggest that the current upward move is a bull trap, rather than a bullish wave. This could still have further to run to the upside, but the stochastic would suggest that this is the final upward move within this trend. It is technically bullish, but longs should be looking for potential market reversals based on the behaviour of the stochastic.
The recent pullback in the April futures is now entering an area of support at the upper range of the primary trend marked in red. As we enter the support area, we can see that momentum has now broken to the downside, indicating that the trending condition for the April futures could be drawing to a close. Although on support and technically still bullish, any upward moves from here should be considered as swing trades only. It is likely to meet selling resistance, with US$ 10,980 being the first point of target. On technical support, this trend looks to be in transition from bull to neutral/bear.
The December to February trend support has now been broken, however the longer term trend remains in place in the Cal 18. The 34 period EMA has been the key average during this trend, and that is about to be tested for the first time this year. If broken it would suggest that the Cal 18 is entering into a corrective phase. Any upward move that closes above US$ 9,200 would suggest that we should once again test the recent highs at US$ 9,496. However the same basis to the rest of the Panamax sector applies here. The momentum pullback would suggest that the upward move is running out of steam for now. Technically bullish, caution of the momentum pullback.
The Q2 V Cal 18 spread has entered into a corrective phase, with the stochastic showing a bearish cross, however at 78 it remains in a bullish environment above the 70 level. Support is coming from the 8 period EMA at US$ 838. A close below this level would suggest potentially further downside, with US$ 650 being the next logical target. Upside moves from here should find resistance at recent highs of US$ 1,124. A close above this level would have bullish implications going forward. It is worth noting that although technically bullish, with the weekly stochastic at 96, and the daily stochastic at 78 it would suggest that upside moves from here.
SUPRAMAX
Having found support in the zone mentioned on the weekly FFA note, the index is now testing the bull trend support that ran from Feb 16 to Jan 17. In theory the previous support should now act as a resistance, a rejection of the trend channel in the chart would suggest that the index should once again test the support zone (US$ 7,525 – US$ 6,750) that we visited in Jan – Feb of this year. A close back into the trend channel has bullish implication going forward and index could test previous highs. The placement of the stochastic at 54 is bullish. However, like the Panamax, the stochastic pullback would suggest this is a corrective upward wave within a downward trend.
The Q2 Supramax has broken below the 8 period EMA for the first time since December, as it enters into a corrective phase. It is currently testing the 20 period simple moving average. The bullish trend has been neutralised by the recent lower low, a lower high would suggest that we are entering into a more sustained corrective phase. A downside break of the 20 period MA at US$ 9,310 would target the 34 period EMA at US$ 8,827. Conversely technical buyers will look to enter the market on a close above the recent high at US$ 9,688.
Source: Freight Investor Services (FIS)
US Coast Guard provides additional ’post type-approval’ guidance to its ballast water regulations
ballast water management (BWM) extension program. According to the Coast Guard Maritime Commons, this MSIB was issued in response to numerous extension requests and questions received by the Coast Guard which indicate a widespread misunderstanding of the previously issued guidance and an associated need for additional clarity and certainty for all stakeholders. See also our Alert “US ballast water management extension program update” of 24 January 2017.
 |
Notably, the USCG emphasises the need for shipowners to provide sound evidence of whether or not a USCG type-approved BWM system is “available” for the vessel in question before granting an extension. This means that shipowners will have to study the available type-approvals, understand the technical constraints associated with each system, and justify why these systems are not appropriate for a particular vessel. However, while the USCG recognises that “one size does not fit all” as regards BWM systems and that it will take a variety of type-approved systems to meet the needs of the global fleet, it also makes it clear that extensions will not be granted indefinitely.
The Coast Guard Maritime Information Exchange is the official website listing USCG type-approved equipment. However, as of March 2017, copies of certificates for type-approved BWM systems, including appendices, can also be found via the USCG’s ballast water portal.
US ballast water regulations – a recap
The US has not acceded to the IMO BWM Convention but has instead adopted its own ballast water management requirements which are set out in Title 33 Code of Federal Regulations (CFR) Part 151 Sections 151.1510 and 151.2025. The regulations, which entered into force in June 2012, apply to all non-recreational vessels, both US and foreign, that are equipped with ballast tanks and intend to discharge ballast water into US waters. A vessel’s compliance date is determined by its first scheduled dry-docking after 1 January 2014 or 1 January 2016, depending on the vessel’s ballast water capacity. Upon a vessel’s compliance date, it must use one of the accepted BWM methods listed in the regulations. For most vessels, this means that a USCG authorised ballast water treatment system must be installed and used. See also our Alert of March 2012 for more details.
The BWM extension program
Regulation 33 CFR 151.2036 allows the USCG to grant an extension of a vessel’s compliance date to a shipowner who has documented that, despite all efforts, compliance with one of the accepted BWM methods is not possible. Prior to December 2016, when no USCG type-approved BWM system was available, it was relatively simple for a shipowner to document that this was not possible. As three BWM systems have now been type approved, this changes the way the USCG approach these extension requests and the following guiding principles provided in MSIB 03-17 should be noted:
- A request for an extension should be submitted 12-16 months before the vessel’s compliance date. Requests submitted too late risk being rejected due to time constraints during the review process. Requests submitted too early may have to be revised due to changes in the market or availability of USCG type-approved systems.
- The request should contain a strategy for compliance, outlining the steps to be taken to bring the particular vessel in compliance with the regulations before the end of the extension. This may require the inclusion of a timeline and installation plan for a USCG type-approved BWM system. Requests that do not provide a justification as to why compliance with one of the accepted BWM methods is not possible by the vessel’s current compliance date will be rejected.
- If an extension is granted, it will no longer be linked to the vessel’s dry-docking schedule, but will contain an “expiry date” based on the compliance strategy and installation plan provided in the request. Further extensions to those granted after 6 March 2017 should not be anticipated.
- A vessel with an Alternate Management System (AMS) installed do not qualify for an extension because the vessel is in compliance with the regulations. The AMS can be used for a period of five years after the vessel’s compliance date. New installations of AMSs are still considered by USCG as an acceptable method of complying with the regulations – but only if it has been determined that a USCG type-approved system is not appropriate for the particular vessel.
Recommendations
Most vessels trading on US ports will need to install a USCG type-approved BWM system eventually and Members and clients are advised to start the preparatory work as soon as possible. The USCG recommends shipowners to proactively engage a vessel’s Flag State, Classification Society, as well as the USCG, when developing the compliance strategy for a vessel as this may prevent delays or lapse in eligibility to trade in US waters. It may also be necessary for shipowners to work closely with the BWM system manufacturers to ensure that the systems in development meet the needs of their vessels.
For those still in the process of planning the installation of a ballast water treatment systems, key elements of the preparatory work is also highlighted in our Alert “Prepare to manage ballast water“ of 8 December 2016.
Source: GARD (http://www.gard.no/web/updates/content/22957795/us-coast-guard-provides-additional-post-type-approval-guidance-to-its-ballast-water-regulations)
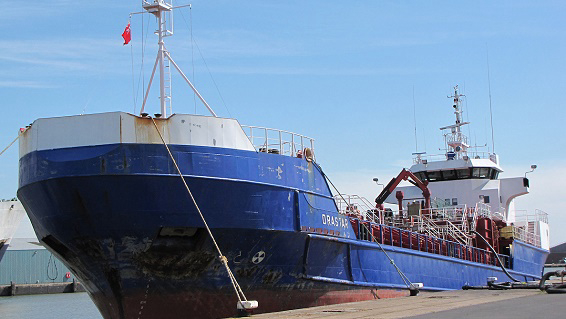
IMO Secretary-General urges vigilance after tanker hijack

 |
Management Practices,” Mr Lim said.
He also called upon the Federal Government of Somalia and its regional authorities in Puntland to take prompt action to ensure the safe and speedy release of the eight Sri Lankan seafarers.
Data on incidents reported to IMO shows that the hijack of the tanker Aris 13, on 13 March, is the first reported hijack of a vessel covered by IMO regulations by Somali pirates since the tanker Smyrni in May 2012. Since 2012, although piracy has been largely contained, Somali pirates have continued to attempt to hijack ships, but less frequently. The most recent reported attempted attack in the region was on the UK flagged product tanker CPO Korea in October 2016. In that incident, the ship was reported safe after the attack failed.
Ships transiting the high-risk area are advised to follow IMO guidance and best management practices. Specifically, they should register with the Maritime Security Centre – Horn of Africa (MSCHOA), report to the UK Maritime Trade Operations (UKMTO) office in Dubai, which acts as the primary point of contact for merchant vessels and liaison with military forces in the region, implement IMO guidance and Best Management Practices (BMP), and follow the Internationally Recommended Transit Corridor (IRTC).
www.imo.org
Japanese Orderbook: Down But Showing Staying Power
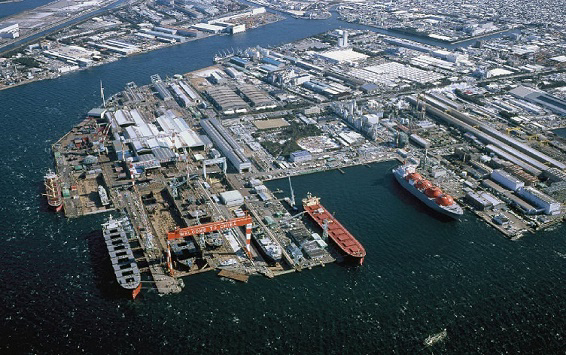
While the orderbook is shrinking for all of the ‘big 3’ builder countries, the Japanese orderbook is undergoing the slowest rate of decline. This month’s Shipbuilding Focus takes a look at the development of the Japanese orderbook.
 |
Slower And Steadier
As of start March 2017, the orderbook at Japanese yards stood at 775 ships of a combined 18.9m CGT, the second largest globally. This was its lowest monthly level since January 2014 in CGT terms. However, the Japanese orderbook has experienced the smallest year-on-year decline amongst the top 3 builder nations, 23\% in CGT terms compared to a 28\% and 36\% decline in China and Korea respectively. Furthermore, ‘forward cover’ (an indicator of future work volumes calculated by dividing the total orderbook by the previous year’s output level) at Japanese yards is currently 2.7 years in CGT terms, surpassing 2.5 years at Chinese yards and much higher than Korean yards’ 1.5 years. 59 Japanese yards currently have a ship (1,000+ GT) on order, compared to 120 Chinese yards and 16 Korean yards. The top 6 Japanese builder groups each have over 1m CGT on order and together account for around 70\% of the Japanese orderbook.
Bigger Ship Benefits
In recent years, the Japanese orderbook appears to have grown more diversified. The share of bulkers on order has declined from 74\% in CGT terms in March 2012 to 34\% currently, while the share of tankers on order has remained steady at around 25\%. Meanwhile, the share of boxships and gas carriers on order has increased from 5\% in March 2011 to 34\% as yards secured orders for larger ships in these sectors. 89\% of boxship CGT on order is accounted for by units of 12,000+ TEU, while LNG carriers of 150,000+ cu.m. account for 83\% of the gas carrier orderbook at Japanese yards. These larger units help to extend the Japanese orderbook and Japanese yards have 1.8m CGT due to be delivered in 2020 or later, compared to 0.1m CGT at Chinese yards and 0.4m CGT at Korean yards.
Home Is Where The Orders Are
Japanese yards are supported by domestic owners, with 70\% of the Japanese orderbook (where ownership is known) accounted for by domestic owners in CGT terms. NYK, MOL, K-Line and their subsidiaries account for 16\% of the orderbook in CGT terms. While Korean and Chinese yards also benefit from domestic ordering, Japanese yards are working with the second largest national ownership base, 163.6m GT compared to the Chinese and Korean owned fleets of 140.4m GT and 55.1m GT respectively.
So, Japanese yards are backed by a strong domestic owner base and the orderbook is becoming more diversified across the major vessel sectors, with orders for larger vessels securing a longer backlog of work. Whilst the fortunes of Japanese yards will depend on the changing shipbuilding environment, they currently have the second largest orderbook globally in CGT terms and in today’s tough newbuild contracting market, this appears to be relatively resilient.
Source: Clarkson Research
![]()
Powered by ![]() © Μaritimes 2019
© Μaritimes 2019