

Singapore maritime could gain from Brexit
The Lion City’s rapid rise as an international shipping centre has been well documented and it could benefit from the UK’s move to the EU combined with its own long-term relationship with Britain, which includes a largely English law-based legal system.
“It can be argued that Brexit means good news for Singapore regardless of the permutations ahead, which remain largely unknown,” said Bill Ricquier, md of Incisive Law
“Looking at Brexit with the glass half-empty from a UK perspective, Singapore is well-positioned to benefit from any decline in London’s status as a maritime centre, given the low barriers to doing business in Singapore, its legal, cultural and services-focused synergies with the UK, particularly when it comes to meeting the needs of shipping interests, as well as its vital geo-strategic position in the world’s fastest growing maritime region.”
On an opposite scenario of glass half empty for Singapore, it could benefit from the UK looking beyond the EU more in terms of trade treaties.
“It would be encouraging to see Singapore near the front of the queue when bilateral trade negotiations open, particularly given the historic ties between the two nations and the status of both as key global financial centres,” Ricquier said.
The bid by the Singapore Exchange for the Baltic Exchange was also flagged as example of growing ties between the two maritime centres regardless of Brexit.
“Indeed, increased ties between London and Singapore, as illustrated by the Singapore Exchange (SGX) proposed acquisition of the Baltic Exchange, appear to be inevitable and sensible, whatever the long-term consequences of Brexit for London and the UK as a maritime hub,” he said.
www.seatrade-maritime.com
Global Fleet Growth: A More Mature Trend?
In recent years the overall pace of growth of the world fleet appears to have slowed and stabilised. However, the pattern of fleet expansion across the key shipping segments shows a wider range of growth trends.
Time To Take It Slow
 Following a rapid expansion in the size of the fleet, the pace of world fleet growth has slowed in recent years. At the start of July 2016, the global fleet totalled 91,773 ships of a combined 1,237m GT. Historically high levels of newbuilding investment and subsequent record shipyard deliveries saw the fleet increase 64\% between the start of 2005 and 2012 to total 1,035m GT. Annual fleet growth has since slowed, falling to around 3.7\% in 2014 and 2015, limited by firmer demolition activity and generally lower deliveries. In the year to date, the world fleet has grown by 1.5\% in tonnage terms and is projected to expand by 2.7\% in full year 2016. This would be the slowest rate of annual fleet growth in over a decade.
More Mature Fleet Growth
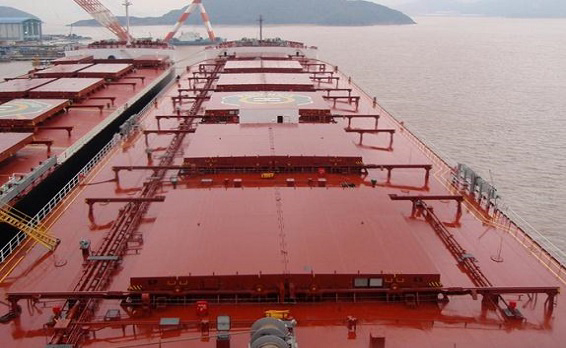
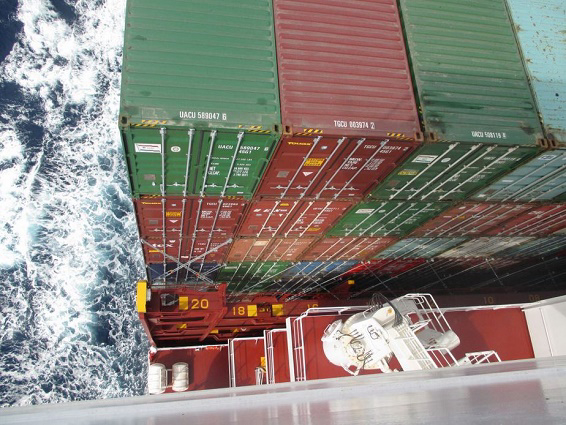
Several key ship sectors have generally experienced slowing rates of fleet growth in recent years. The bulker fleet currently accounts for 35\% of the fleet (432.6m GT) and has grown by a mere 0.7\% in 1H 2016. Historically weak earnings supported record levels of bulker demolition in Q1 2016 and this has limited the impact of deliveries on the size of the fleet. This compares to a CAGR of 8.2\% between start 2005 and 2016 in the bulker fleet with peak growth of 16.9\% p.a. in 2010. Elsewhere, the expansion of the global boxship fleet has slowed considerably, averaging 4.7\% p.a. between 2011 and 2015 compared to 10.7\% p.a. between 2005 and 2010. Weaker demand has led to sporadic ordering with upsizing counterbalanced by firm demolition in certain sectors, and the boxship fleet has grown by just 1.0\% in 1H 2016, in GT terms.
New Lease Of Life
However, there are several ship sectors where fleet growth is picking up pace. The oil tanker fleet has grown by 2.6\% in the year to date to 283.3m GT at the start of July, equivalent to 23\% of the global fleet. This compares to fleet growth of 3.0\% in full year 2015, and just 1.4\% in 2014, with a firm market having supported delivery volumes and limited demolition. Elsewhere, fleet growth in the gas sector rose to 8.8\% in 2015 and the fleet has expanded 4.6\% in 1H 2016. The LPG carrier fleet has increased by 9.6\% in 2016 so far after a firm earnings environment encouraged newbuild investment in recent years. This compares to a 5.4\% CAGR in the 2005-15 period. LNG carrier fleet growth has been more moderate in 1H 2016 at 2.7\%, with weaker demand not only delaying investment decisions but also slowing deliveries.
For a shipping industry struggling with oversupply and lower demand growth, slower fleet growth could provide a note of positivity. Although firm expansion in the tanker and gas carrier fleets may put pressure on these sectors, weaker fleet growth in the bulker and boxship sectors could help start to rebalance these markets. For the latest fleet growth trends, keep on reading World Fleet Monitor.
Source: Clarksons
RINA certifies Commitment to Environment and Safety of Carnival Maritime

Now the Carnival Maritime office in Hamburg as well as 26 ships in Carnival Maritime’s fleet have been awarded environmental management ISO 14001 and occupational health and safety management BS OHSAS 18001 certifications. The certified fleet includes Costa and AIDA ships.
Initially only ships belonging to Costa Crociere were included in RINA Services scope of work. This was then expanded to include AIDA Cruises ships, in order to incorporate best practice across both fleets.
Not only do these new certifications make Costa Group’s fleet greener and safer, but also more cost effective. “RINA Services was invaluable to us during the execution of this project. We were confident that they could easily adapt to certify our newest ships as well. We have an integrated fleet that allows us to put sustainability and safety management at the heart of our business” said Lars Ljoen, Managing Director Carnival Maritime GmbH.
The certifications were presented by Michele Francioni, CEO, RINA Services to Lars Ljoen, Managing Director Carnival Maritime at a ceremony in July.
“We are very pleased that we were able to help Carnival Maritime with this project. Not only did it build on our relationship with Carnival Maritime, but it also further supported our strategy to become a hub for marine certification services in Eastern and Western Europe” said Michele Francioni, CEO, RINA Services. RINA Services is currently working to support Carnival Maritime across several projects in Germany.
RINA Group, the parent company of RINA Services, opened a new office in Germany, Hamburg earlier this year to support its German clients with new specialist expertise, including Asset Integrity Management and Technology Qualification.
Today, the Group is able to provide enhanced marine services, business assurance certification and consulting engineering to German and North European companies. RINA Group was also recently permitted to certify energy management systems according to the ISO 50001 standard, which makes it easier for organisations to integrate energy management into their strategy to improve quality and environmental management.
Carnival Maritime is the marine service unit for the Costa Group, Europe’s leading Cruise Company. This unit bundles competences and best practices in the area of marine operations to achieve the highest security standards in the cruise industry for the fleet of the Costa Group, which currently includes 26 cruise ships of the brands Costa Crociere, Costa Asia and AIDA Cruises. Carnival Maritime combines the company’s expertise in the areas of marine, technology, health, environmental protection and security for the Costa Group in Hamburg. The unit was founded in 2015, and employs 150 specialists.
RINA Services S.p.A. is the RINA company active in classification, certification, inspection and testing services.
RINA is a multi-national group which delivers verification, certification, conformity assessment, marine classification, environmental enhancement, product testing, site and vendor supervision, training and engineering consultancy across a wide range of industries and services. RINA operates through a network of companies covering Marine, Energy, Infrastructures & Construction, Transport & Logistics, Food & Agriculture, Environment & Sustainability, Finance & Public Institutions and Business Governance. With a turnover of over 378 million Euros in 2015, over 3,000 employees, and 163 offices in 60 countries worldwide, RINA is recognized as an authoritative member of key international organizations and an important contributor to the development of new legislative standards. www.rina.org
Diana Shipping Inc. Updated Price Targets
Recent broker ratings and price targets:
04/21/2016 – Diana Shipping inc. was downgraded to “sell” by analysts at ABN Amro.
03/08/2016 – Diana Shipping inc. was downgraded to “sell” by analysts at Deutsche Bank. They now have a USD 1.5 price target on the stock.
02/09/2016 – Diana Shipping inc. had its “neutral” rating reiterated by analysts at Clarkson Capital.
01/15/2016 – Diana Shipping inc. had its “sell” rating reiterated by analysts at UBS. They now have a USD 2.25 price target on the stock.
01/11/2016 – Diana Shipping inc. was downgraded to “underweight” by analysts at Barclays. They now have a USD 3 price target on the stock.
11/20/2015 – Diana Shipping inc. was downgraded to “market perform” by analysts at Wells Fargo. They now have a USD 5.5 price target on the stock.
10/26/2015 – Diana Shipping inc. was downgraded to “hold” by analysts at Jefferies. They now have a USD 6.5 price target on the stock.
10/15/2015 – JP Morgan began new coverage on Diana Shipping inc. giving the company a “neutral” rating. They now have a USD 7 price target on the stock.
08/03/2015 – Diana Shipping inc. was downgraded to “hold” by analysts at Stifel Nicolaus. They now have a USD 8 price target on the stock.
07/27/2015 – Diana Shipping inc. was downgraded to “sell” by analysts at Evercore ISI. They now have a USD 6 price target on the stock.
05/01/2015 – Diana Shipping inc. was downgraded to “sell” by analysts at Zacks.
02/25/2015 – Diana Shipping inc. was downgraded to “equal weight” by analysts at Morgan Stanley.
02/20/2015 – Global Hunter Securities began new coverage on Diana Shipping inc. giving the company a “neutral” rating.
11/10/2014 – Sterne Agee began new coverage on Diana Shipping inc. giving the company a “neutral” rating.
10/07/2014 – GMP Securities began new coverage on Diana Shipping inc. giving the company a “buy” rating. They now have a USD 15 price target on the stock.
Diana Shipping inc. has a 50 day moving average of 2.54 and a 200 day moving average of 2.67. The stock’s market capitalization is 244.12M, it has a 52-week low of 1.95 and a 52-week high of 7.96.
The share price of the company (NYSE:DSX) was down -1.29\%, with a high of 3.12 during the day and the volume of Diana Shipping inc. shares traded was 465165.
Source: FTSE News
Just How Big Is An Economy Without Borders?
But putting it into context in actual annual value terms, how does the magnitude of the shipping business compare to the size of some of the world’s economies?
Big Traders
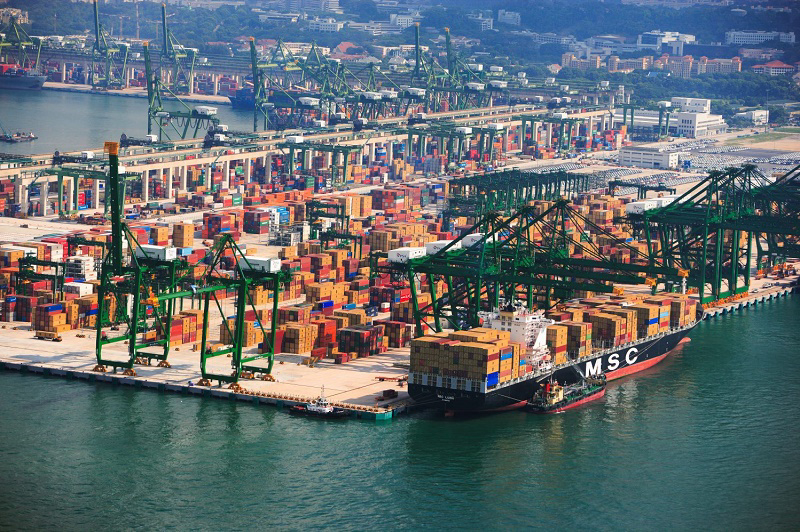
 There are a number of ways to attempt to put the annual impact of the shipping industry into the context of the wider world economy. One is to examine the value of seaborne trades. Seaborne iron ore trade totalled 1.3bn tonnes in 2015. At an annual average ore price of around $50/t, that equates to a value of $68bn. That’s about the size of the GDP of Kenya. However, that’s dwarfed by seaborne crude oil trade. At 37.4m bpd last year, at an average oil price of around $52/bbl, that’s an annual value of $717bn, almost equivalent to the GDP of Turkey (the world’s 18th largest economy). On the container side, taking port handling as an interesting metric, last year there were an estimated 664m TEU lifts at the world’s box ports. Average handling charges vary significantly, but if they worked out at $150/TEU that’s an economy of just under $100bn, almost the size of the GDP of Angola.
Of course the value of global seaborne trade must be huge. The WTO estimates the value of all global trade at $16.5 trillion, and almost 85\% by volume moves by sea. Seaborne trade is probably a little skewed to relatively cheaper goods but even allowing for, say, 50\% of the total value, that’s still over $8 trillion, heading towards the size of China’s economy!
Adding The Value
Another way to put shipping’s magnitude into context is to take a look at the value of the assets. Between 2007 and 2015 the average annual level of investment in newbuildings was $127bn. That’s bigger than the GDP of Hungary. Alternatively, taking the value of the fleet today, $904bn, and allowing for, say, another 15 years of trading (the average age by tonnage is around 10 years), would equate to a per annum value of $60bn, still bigger than the economy of Panama.
Call In The Revenue
But perhaps the clearest way to mirror GDP is to check the annual earnings of the vessels, just as GDP measures economic production. In 2016’s challenging market conditions, the ClarkSea Index has averaged $9,733/day (which would total aggregate earnings of $77bn in a full year across the c.22,000 vessels in the main volume sectors), but back in 2007 it averaged over $33,060/day (across over 15,600 vessels). Across a year that’s earnings of $189bn. Almost as big as the economy of shipping’s favourite investor nation, Greece!
A Big Whole
Shipping is just one of a wide range of economic activities on the planet. Sometimes its impact can be hard to put into context. But in terms of ‘economic magnitude’, elements of the shipping industry can be as big as the whole of one of the world’s larger economies, especially in a good year. Have a nice day!
Source: Clarksons
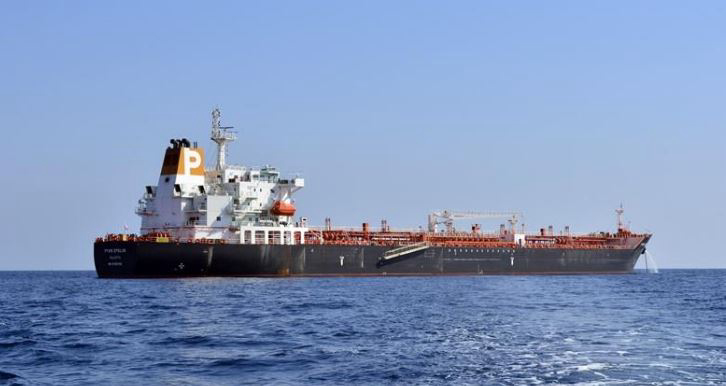
A pure play product tanker company Finalist for the Company of the Year
 |
Pyxis is focused on growing its fleet of medium range product tankers, which provide operational flexibility and enhanced earnings potential due to their "eco" features and modifications.
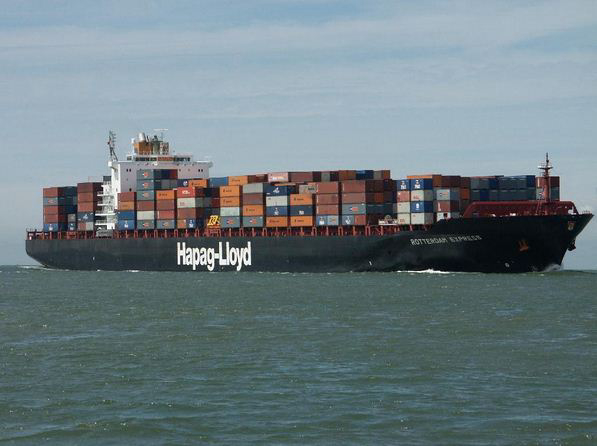
The ‘new Hapag-Lloyd’ unveiled in merger agreement with UASC
Included is a plan for a $400m cash capital injection, by way of a rights issue, within six months of the proposed transaction.
The future equity funding of the mega marriage is among the key developments unveiled in a just released Business Combination Agreement (BCA) and separate Shareholders Support Agreement (SSA).
The combined entity, interestingly positioned as the “new Hapag-Lloyd”, will as expected remain a registered and stock listed company in Germany with its head office in Hamburg, subject to the necessary regulatory and contractual approvals.
Today’s media release, providing the first concrete details of the nuptials, highlighted UASC’s solid presence in “Middle Eastern markets and trades” and the new company’s “commitment to further strengthening this presence by establishing a fifth Hapag-Lloyd Regional Centre in Dubai.”
Interestingly, Qatar Holding LLC (QH) and The Public Investment Fund of the Kingdom of Saudi Arabia (PIF), the majority shareholders of UASC, are poised to become “key” shareholders in the Hapag-Lloyd holding – albeit minority on paper given QH is poised to take a 14\% stake and PIF just 10\%.
CSAV Germany Container Holding GmbH, HGV Hamburger Gesellschaft für Vermögens- und Beteiligungsmanagement mbH (City of Hamburg) and, logistics billionaire Klaus Michael Kühne’s Kühne Maritime GmbH will remain controlling shareholders of Hapag-Lloyd.
Under the terms of the SSA, “some” of the controlling shareholders of either side have committed to backstop the $400m cash capital increase by way of the proposed rights issue.
Following the integration, the new Hapag-Lloyd will rank among the five largest container shipping lines in the world, with 237 vessels and a total capacity of approximately 1.6m teu, an annual transport volume of 10m teu and a combined turnover of approximately $12bn.
The fleet of the combined company – including UASC´s six recently received 18,800 teu ships and 11 newly built 15,000 teu boxships (the last of which will be delivered soon) boasts an average age of 6.6 years and average size of 6,600 teu.
“This strategic merger makes a lot of sense for both carriers as we are able to combine UASC’s emerging global presence and young and highly efficient fleet with Hapag-Lloyd’s broad, diversified market coverage and strong customer base,” said Hapag-Lloyd ceo Rolf Habben Jansen, describing the merger as another “historic milestone” for the German company following the successful integration of CSAV last year.
“Furthermore it will give the new Hapag-Lloyd access to ultra large container vessels.”
The combined company will have a global, diversified trade portfolio, with leading product offerings in the major East-West and North-South trades.
“With this merger, we are embarking on an exciting new phase of UASC´s growth,” said Jorn Hinge, the president and ceo of UASC whose role in the merged company remains unclear.
“Leveraging on UASC´s heritage in the Middle East as well as our recent growth in other markets, the combined company will provide customers with valuable expertise and very efficient service offerings in all major trade lanes and markets around the world”, he added.
The company will be the key player in the new “THE Alliance” – consisting of Hanjin, Hapag-Lloyd, K-Line, Mitsui OSK Lines, Nippon Yusen Kaisha (NYK) and Yang Ming. THE Alliance is scheduled to begin operation in April 2017 and will cover all East-West trade lanes including Asia-Middle East/Arabian Gulf and Red Sea.
“Hapag-Lloyd and UASC now take the next step to further consolidate and shape the liner shipping industry. The new transaction is strengthening not only our market position, but also our service portfolio. The merger will create annual net synergies of at least $400m and save a significant amount of capital expenditure for the company,” said Michael Behrendt, chairman of the Supervisory Board of Hapag-Lloyd.
Pending regulatory and contractual approvals, the merger is expected to be completed by the end of 2016. Until then, UASC and Hapag-Lloyd will continue to operate as stand-alone companies. Each company will also operate in its own alliance as currently structured until the end of March 2017, after which THE Alliance will commence operations.
It is the third major M&A transaction in container shipping in the last 12 months following CMA CGM’s buy out of Neptune Orient Lines (NOL), and the merger of Cosco Container Lines and China Shipping Container Lines (CSCL) as part of the wider merger of their parent companies. Hapag-Lloyd has been repeatedly linked to a possible merger with NOL over the years but no deal has come to fruition.
http://www.seatrade-maritime.com/
Marine Equipment Industry: How Greek shipowners could stimulate the manufacturing sector

Apart from the widely acknowledged boost from net shipping receipts to the Greek economy, a critical issue is to explore additional channels through which the economic power of Greek ship-owners could feed into the Greek economy.
While global shipbuilding activity is largely concentrated (with 90 per cent being built by Asian shipyards), the market for marine equipment is highly diversified in an extensive network of global supply chains. NBG Research estimated that Greek ship owners “control” about 1/10 of this market, by creating an annual demand of about €8 billion in marine equipment.
Against this background, Greek marine equipment manufacturers appear to be in an advantageous position to access global value chains, using the influence of Greek ship-owners. However, this opportunity appears to be underexploited since Greek production is in the range of just €0.15 billion (about 0.1 per cent of global production).
Shipbuilding and ship repair activities create a demand for marine equipment, concerning products such as machine engines, navigation systems, electrical and electronics systems, as well as metal products and materials, paints, ropes, wires etc. This market is clearly diverse and not easily specified. It is estimated that the global marine equipment market covers about 65 per cent of the cost of shipbuilding (varying among different ship types and the level of required sophistication). Driven by increasing shipbuilding orders during the previous decade, the global production of marine equipment reached €120 billion in 2015 (almost double compared with 2000). While shipbuilding activity has become increasingly concentrated, marine equipment production is more dispersed in the context of an extensive network of global value chains.
Specifically, 37 per cent of marine equipment market is served through international trade flows in 2015, compared with 25 per cent in 2000. Against this background, shipbuilding has become a sector with one of the highest participation rates in global value chains (GVCs)3 (about 32 per cent versus a world average of 26 per cent), reflecting mainly the above-mentioned high share of marine equipment being imported. Trade of marine equipment flows both inter-regionally (mainly from EU to Asia) and intra-regionally (mainly intra-EU):
Turning to inter-regional trade, the EU produces a surplus amounting to around 6 per cent of the global market (as EU countries have a share of 34 per cent in supply and 28 per cent in demand), which mainly is directed to cover Asia’s deficit (as Asian countries generate 49 per cent and absorb 55 per cent of the world marine equipment production).
Regarding intra-regional trade, EU countries depend more on intra-regional trade (covering approximately ⅓ of the region’s demand), while Asian countries appear to be the most self-sufficient (with intra-regional trade covering 14 per cent of the region’s demand). EU countries are the most export-oriented, exporting 57 per cent of production (about 45 per cent concerning intra-EU trade).
Germany is the largest EU exporter (supplying more than ⅓ of EU exports), followed by Italy, the UK, The Netherlands and France, each having a market share of about 8-10 per cent. During the past decade, EU exports increased by about 25 per cent from €20 billion in 2005 to about €25 billion in 2015, covering 55 per cent of world exports (down from 67 per cent in 2005). This increase mainly reflected higher demand from Asia (covering 30 per cent of EU exports in 2015 compared with 17 per cent in 2005), while the level of intra-EU trade remained broadly unchanged. Note that China, in particular, absorbed 13 per cent of EU exports in 2015 compared with 7 per cent in 2005.
As higher demand from Asia was also covered through intra-Asia trade, the abovementioned increase in EU exports to Asia was just enough to maintain EU penetration in Asian markets at the same level (about 40 per cent). It should be noted that there are certain differences concerning specific types of marine equipment. For instance, EU countries appear to cover more than ½ of Asian imports of propulsion systems (machine engines), compared with only 14 per cent in navigation systems (mainly covered from intra-Asia imports). This type of marine equipment is the main focus of German exports, which is a key player in marine equipment destined for Asia, covering 45 per cent of EU exports to Asia compared with 31 per cent of EU exports to other destinations.
Turning again to the Greek ship-owners’ prominent position in the markets related to shipping, NBG Research estimated that Greek ship-owners create an annual demand of about €8 billion in marine equipment, of which €6 billion concern the building of new ships (through shipyards) and the remaining €2 billion concern direct expenditure by shipping companies for repairs and fleet maintenance (spare parts, etc.).
Supply-side weaknesses hinder Greek manufacturers from capturing a sizeable share of the global marine equipment market
Combining the above-mentioned points, Greek marine equipment manufacturers appear to be in an advantageous position to gain access to the GVCs’ network of the shipbuilding sector, using the influence of Greek ship owners. Specifically, during the shipbuilding process, there is a dynamic interaction between ship-owners and shipyards concerning the selection of marine equipment suppliers. At first, the list of eligible suppliers is prepared by the shipyard by taking into account the recommendations of the customer.
Then, from this list and based on the desired specifications for each type of delivery (considering factors such as quality, cost and degree of sophistication), the final choice is made by the shipyard. In this context, Greek ship-owners could use their influence in order for the Greek manufacturers to be included in the shipyards’ suppliers list and thus have a fair chance to be the selected suppliers (in case they offer the best price-quality combination).
In this case, Greek ship-owners (i) will intensify the competitive forces during the selection process (with favorable results regarding lower prices and/or higher quality), (ii) will have easier communication with the suppliers – in cases that Greek manufacturers would be selected, and (iii) could move towards vertical integration by acquiring shares in Greek marine equipment companies. However, this opportunity appears to be underexploited since Greek production is in the range of just €0.15 billion – corresponding to 0.1 per cent of the global market. The marine equipment output of Greek companies mainly concerns: (i) ship operation equipment (mainly mooring equipment) and cargo handling equipment (mainly wire ropes, cables, anchors); as well as (ii) high value added products such as auxiliary systems for environmental protection and safety (e.g. ballast water treatment), navigation and bridge control and other electronics and IT systems. In fact, focusing on the sub-segments that Greek manufacturers are more active (cargo handling equipment, ship operation equipment and auxiliary systems, covering ⅓ of the total market), Greece’s market shares in the respective markets remain extremely low (in the range of 0.3 per cent).
In order to explore the potential growth of the sector of marine equipment and determine what factors may currently limit its development, NBG Research has constructed an econometric model (see Appendix) based on a global sample of 33 countries, examining the combined effect of two broad types of variables:
Demand variables index: (i) each country’s share in the world shipyard activity; and (ii) each country’s share in the world fleet Supply variables index: (i) each country’s size; (ii) technology level; and (iii) cluster sophistication. From the demand side, marine equipment production is directly absorbed by shipyards or by shipping companies (for repairs and replacement of parts). However, as mentioned above, there is also an indirect channel through which ship-owners can influence the shipyards’ choices.
Turning to supply side considerations, an integral part of marine equipment competitiveness is technology, especially as specifications become more complex, with advanced systems required in terms of mechanics, navigation, safety and environmental protection. Based on our Technology Index, most developed countries in this area are Korea, Finland and Sweden. Moreover, cluster sophistication appears to be an important tool for entering high-tech global value chains, with countries like Germany, the US and Italy being the most advanced in this area.
Finally, it is important to control the effect of the size of the economy of each country, as high impact countries such as China (covering 14 per cent of world exports), the US and Germany (about 10 per cent each) have a natural advantage in gaining excess to highly competitive global markets (through exploiting both bargaining power and economies of scale). By combining the above factors through econometric modelling, the share of each country in the global production of marine equipment production is explained to a large extent (R2= 87 per cent), with countries with powerful combinations of demandrelated and supply-related attributes (mainly China, Japan, Korea, the US and Germany) capturing double-digit shares of the world market.
Under this approach, Greece produces a fair value share in the world marine equipment market close to its realized one (0.1 per cent of the market), as:
In the demand index, Greece ranks rank close to the EU average (7 per cent lower) as, despite being a world leader in terms of fleet ownership, this effect is counterbalanced by the very limited shipyard activity – covering about 0.2 per cent of world shipyard turnover (lower even than its share in world GDP which is about 0.5 per cent). Note that European countries such as Norway, Italy and Germany maintain a relatively high ranking both in terms of fleet control and shipyard activity.
However, in terms of supply-related variables, the characteristics of the Greek business environment lead to an index 47 per cent lower than the EU average (ranking last among the examined sample). This is a combined result of low rankings in the three main index components: (i) being a small country, Greece has a low share of about 0.1 per cent in total world exports (excluding fuel), which translates into limited access to global networks; (ii) cluster formation in Greece is considered underdeveloped (based on the Global Competitiveness Index), ranking 33 per cent lower than the EU average; and (iii) the technology level5 in Greece is about 35 per cent lower than the EU average (mainly because of limited R&D investments), while the most developed countries are Korea, Finland and Sweden.
Therefore, the weak spots of the Greek marine equipment market are mainly concentrated on its supply-side weaknesses, mainly limited innovative activity and clustering). The Greek marine equipment sector exhibits signs of dynamism While shipbuilding activity in Greece has declined significantly during the past decade (with shipyard turnover about €50 million in 2013 compared with about €0.5 billion during 2003-2005), marine equipment manufacturers have managed to take advantage of the increase in global demand and more than double production during the past fifteen years.
Specifically, sales of marine equipment reached about €150 million in 2015, from €60 million in 2000. This was achieved through a significant export orientation, either through direct exports or through sales of spare parts to shipping companies in Greece and then exported to shipyards. In fact, about 60 per cent of their turnover is directed abroad (compared with 15 per cent on average for Greek manufacturing – excluding fuel), while their extroversion has increased by 11 per cent annually on average during the past decade (compared with 4 per cent for Greek manufacturing – excluding fuel). Concerning export destinations, about 40 per cent is directed to other EU countries and the rest mainly to Asian countries (China, South Korea and Japan).
These positive characteristics are reflected in a healthy financial performance, as the sector: (i) remained profitable throughout the economic crisis, (ii) performs better than the rest of the Greek manufacturing sector (excluding coke manufacturing) and (iii) has similar ratios with European marine equipment producers (including listed companies with a global presence). Specifically:
During the high growth period of 2005-2008, the sector grew by 18 per cent annually on average, compared with 15 per cent in Europe and 4 per cent in Greek manufacturing. With an advantage in terms of profitability, a slightly higher asset turnover and lower leverage, Greek marine manufacturers outperformed both benchmarks in productivity, with ROA at 11 per cent, compared with 7 per cent in Europe and 4 per cent in Greek manufacturing.
During 2009-2014, the sector posted a slowdown, however, sales continued to grow at an average annual rate of 4.7 per cent, while Greek manufacturing posted an average annual drop of 5 per cent. The significant lead in the high growth period kept the sector close to its European counterparts. The combination of a still high EBITDA (13 per cent) and low leverage (debt to equity less than 1) allows the sector to have a healthy net profit margin before taxes (9 per cent, compared with 8 per cent in Europe and -0.3 per cent in Greek manufacturing) and to easily cover its loan obligations (with a debt-to-ebitda ratio of 2.3 compared with 7.7 for Greek manufacturing). By intensifying, supporting and broadening this effort, the marine equipment industry could directly boost Greek GDP by €0.6 billion per year…
While the efforts of Greek marine manufacturers appear to be in the right direction, they still have a long way to go towards the EU average. Based on NBG Research estimates, in the event technological investments and cluster development reach the levels of the EU average, the Greek sector of marine equipment has a dynamic to reach sales of €0.7 billion (from €0.15 billion in 2015). Specifically, the technology upgrade could increase the Greek market share from 0.1 per cent to 0.4 per cent of world market, which is equivalent to an annual sales benefit of €0.3 billion. To reach the EU-average, Greek manufacturers should intensify their innovation activities by doubling their R&D expenditures to 5 per cent of sales (i.e. the average of EU marine equipment manufacturers) from 2.5 per cent of sales in 2015.
Apart from higher R&D expenditures, it is equally important to target this innovation effort strategically (i.e. towards high-growth segments and away from segments that are already controlled by large players e.g. German manufacturers in propulsion systems). Indicatively, we distinguish “smart shipping” concerning the development of specialized software and applications (e.g. for engine monitoring or weather routing) for optimum ship operation in terms of safety and energy efficiency.
In addition, the improvement in cluster sophistication to the EU average could further increase the Greek market share to 0.6 per cent of world market, thus producing additional annual sales of €0.3 billion. According to the literature6 , the key strategic priorities that would improve Greek sector’s effectiveness and close the gap with the more mature EU clusters are:
to form partnerships and affiliations with mature clusters in other EU countries, such as the Industrial Association of German marine and offshore equipment (VDMA), to improve linkages with (i) clients’ associations (e.g. Union of Greek Ship-owners) through working groups and advisory committees, as well as (ii) research and academic institutions which would foster more effective R&D activity (especially for the smaller enterprises), and to develop industry clusters with presence in strategic locations through permanent offices or representatives (which is beneficial in terms of lobbying and interaction with local partners). Therefore, in this scenario, Greece could capture the 0.6 per cent of the global marine equipment market (from 0.1 per cent in 2015) – corresponding to 1.5 per cent of the relevant for Greek manufacturers markets (from 0.3 per cent in 2015.
… while the indirect benefits through technology spillovers could amount to up to €1.4 billion Besides the above-mentioned direct effects, the gradual increase of Greek participation in global value chains (GVCs) could lead to an additional economic benefit – mainly through technology spillovers and introduction to global high-tech networks. Note that this development could act as a critical trigger, since the participation of the Greek industry to GVCs is low (with 43 per cent of our exports being either raw materials for foreign exports or have an imported input component, compared to an average global ratio of 52 per cent).
In particular, past experience indicates a correlation of about 65 per cent between the growth rate in the GVC participation index and the increase in GDP per capita (see graph). Based on this observed pattern, the increase in GVC participation by 2.5 per cent (caused by the higher marine equipment exports) is expected to increase Greek GDP by 0.6 per cent (€0.6 billion directly and €0.4 billion indirectly). Note, however, that the nature of the spillover effects has, by definition, a high random component. In practice, the indirect effect appears to vary between ½ of the average estimate (e.g. in the case of Indonesia) to double the average estimate (e.g. in The Netherlands).
Therefore, these externalities for Greece (excluding the direct effect of €0.6 billion on marine equipment manufacturing) average €0.4 billion but, in fact, they could range from zero to €1.4 billion.
Our view is towards the upside of this range of potential spillover effects, as the “neighboring”-to-marine equipment sectors (i.e. manufacturing of metals, machinery and electrical equipment) cover 30 per cent of the Greek manufacturing sector (excluding fuel) with annual sales of €10 billion, and are among the most competitive industries in Greece.
In fact, these Greek sectors:
invest 0.8 per cent of their annual sales in R&D, compared with 0.3 per cent in Greek manufacturing are export-oriented and have a high share of exports with competitive advantage (40 per cent of their exports compared with 16 per cent in Greek manufacturing), are comparable with their European competitors in terms of labor productivity, while other manufacturing sectors have a considerable gap of about 40 per cent.
Source: National Bank of Greece
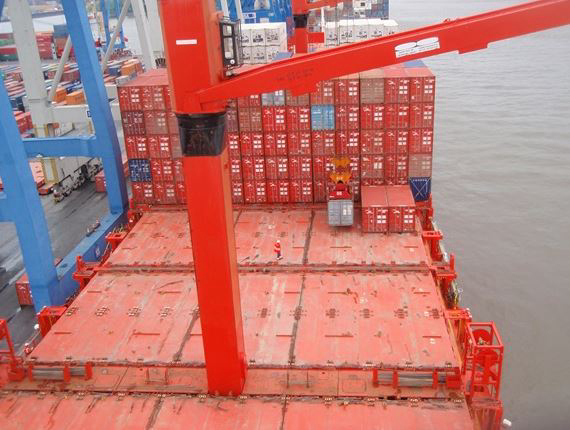
Shipping oversupply to persist despite big scrapping plans says Drewry
Now is not a good time to own an old containership.
Drewry’s Container Forecaster (June 2016) found that, for the first time, 450,000teu of containership capacity is expected to be scrapped in just one year, as the containership sector recognises that there are far too many ships chasing too little cargo.
Based on an average size of 3,000teu for ships which are being scrapped, this means that about 150 mainly old and medium-sized containerships will be pulled out of the market or out of temporary idle positions and sent to the scrapyard in 2016.
In 2015, demolitions were less than half this level (see Figure 1). The surge in demolitions started in 4Q 2015, has continued since and looks set to reach 450,000teu by the end of 2016, an even higher annual total than the 444,000 teu scrapped in 2013. (For disclosure, Drewry consultants have advised some owners and investors to scrap their containerships in recent years, but we have no ownership links with shipowners and have an independent view).
Figure 1
Containership capacity demolitions, by quarter 2015-16 (teu)

Source: Drewry Container Forecaster
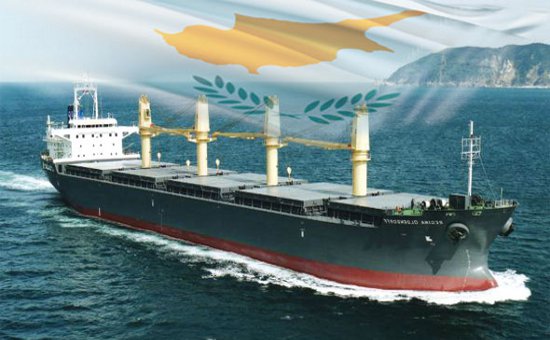
Cyprus Shipping Chamber – Cautious Welcome Over Attracting Shipping Firms Due to Brexit

British ship owning and ship management companies may seek to relocate their headquarters to another EU member-states including Cyprus was raised by Bank of Cyprus major shareholder Wilbur Ross.
“Surely there are prospects not only in relation to England but also globally as to whether Cyprus can be another attractive place for shipping activities,” he said, pointing out that Cyprus has a fully developed maritime cluster.
The Cypriot registry ranks 10th in the world and third in the EU, while Cyprus is considered as one of the biggest ship management centres globally, contributing 7\% to the island GDP Kazakos said.
He however cautioned that “it is too early to reach any conclusions on the next steps as neither the EU nor the UK have concluded to the final exit agreement and that will consequently impact England`s highly developed maritime cluster.”
“What`s important, not because a problem emerged in one country, is for Cyprus to continue maintaining its attractiveness, competitiveness, transparency and its (tonnage tax EU) official approval so that when opportunities arise, to be considered as steady operating base,” he added.
Kazakos said that a small number of Greek shipping companies, amounting to single digits have opened offices in Cyprus, following the uncertainty with regard to the approval of the Greek tonnage tax system. Cyprus` respective tonnage tax system has been approved by the European Commission have been approved under the EU state aid rules.
He said that these firms are quality companies which have employed local staff and foreign specialised personnel.
“These firms have indeed begun operations on a preliminary basis, they are quality companies and I can say that they began joining the ranks of the CSC.” Kazakos said.
Noting that in case the Greek tonnage tax system is not approved there will be more interest from Greek firms, noting that a large number of Greek shipping companies, including companies owned by London-based Greek shipowners, are looking to other EU member-states to relocate their headquarters.
Replying to a question on Cyprus` maritime administration, Kazakos praised the efforts of Transport Minister Marios Demetriades who commissioned a review on the operation of the Department of Merchant Shipping, whereas the Ministry itself will undergo reform in the context of the public administration reform.
“This is a very sound course, a bottom to top reform which will assist the DMS, established in 1963, to reach a more contemporary era to respond to the requirements of shipping, a globalised industry that never sleeps,” Kazakos said.
With regard to the government`s aim to appoint a Deputy Minister responsible for growth, Kazakos reiterated that such an appointment would strengthen the efforts to further promote the Cyprus shipping industry as it will give increased political backing.
Such a position, he said, would assist the DMS complementing the three basic functions for shipping.
Those are, he said, the drafting, supervision and implementation of a national maritime strategy, the representation of Cyprus to the various international shipping forums and the promotion of the Cyprus maritime industry. Kazakos furthermore noted that this political appointment would lead to a clear structure in policy-making issues and problem solving that require political decisions.
Source: GoldNews
![]()
Powered by ![]() © Μaritimes 2019
© Μaritimes 2019