

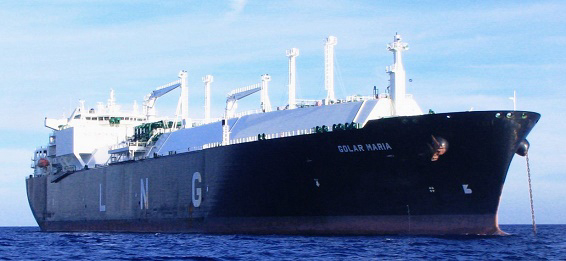
Shipping to become ‘major new sector’ for LNG: Shell
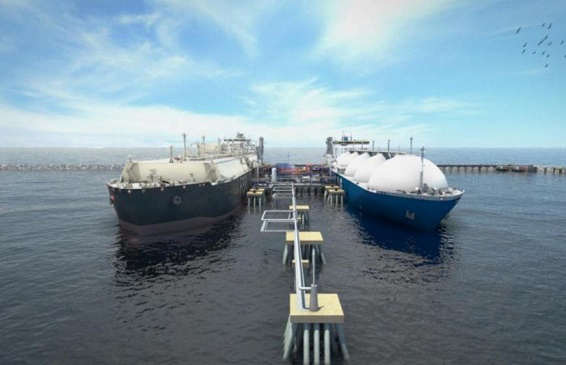
Shell’s head of integrated gas Maarten Wetselaar told investors in London that between shipping and trucking, the transport sector had become “a major new sector” for the LNG market.
The shipping market and the heavy trucking market together represent about 750 million tonnes of potential LNG demand, about three times the current global LNG supply, Mr Wetselaar said. He signalled that last week’s announcement of new rules on emissions from shipping had made Shell more positive on demand from the sector, noting it was an area where the competition was oil rather than cheap coal.
“These sectors have good affordability,” he said. “The alternative is oil, and that’s a price link that we like competing with in the gas side.”
By 2025, 35 million-60 million tonnes of LNG a year could be going into transport, rising potentially past 100 million tonnes by 2030, Mr Wetselaar said. Woodside Petroleum has also identified transportation as a new market and has invested in LNG fuelling infrastructure at Dampier in Western Australia.
Shell’s $US52 billion takeover of BG Group meant the oil major overtook home-grown Woodside Petroleum as Australia’s biggest LNG producer, with capacity in Queensland as well as at the North West Shelf venture in Western Australia. It is also a 25 per cent partner in Chevron’s monster Gorgon LNG project ramping up production, while its Prelude floating project is expected to start up in late 2017 or 2018.
The LNG market is wallowing in a glut, thanks to the several new plants starting up in Australia, with about 12 million tonnes of additional supplies so far this year, chief financial officer Simon Henry said.
But Shell is seeing “healthy growth” in demand, with the Middle East particularly strong, and India and China each increasing imports by about 4 million tonnes so far in 2016, Mr Henry said.
Driving demand as a shipping fuel was last week’s ruling by the International Maritime Organisation that strict new caps on sulphur in fuel oil would come into effect worldwide on January 1, 2020. The cap, which is falling from 3.5 per cent to 0.5 per cent, is expected to force some shipowners to switch to gas given the costs of alternatives such as installing “scrubbers” to clean up emissions.
In total, LNG demand could increase to 420-450 million tonnes a year by 2025, up from about 250 million now, Shell said.
Mr Wetselaar described progress on the Prelude project as “solid”, with the major construction work on the vessel at the shipyard in Korea having been completed.
“We’re into starting commissioning, handing over to operations and working things up,” he said, reiterating Shell’s expectation that Prelude would contribute “substantial cash flow” starting in 2018.
Mr Henry meanwhile flagged significant activity is under way behind the scenes on divestments as Shell targets $US30 billion of asset sales. He said Shell has 16 separate asset sale transactions of more than $US500 million in progress, of which only six are in the public domain, including the New Zealand business.
Shell reclassified its remaining $3 billion stake in Woodside Petroleum as an “asset for sale” earlier this year, apparently signalling a firmer intention to complete its exit from the share register sooner rather than later.
Source: AFR (Australian Financial Review)
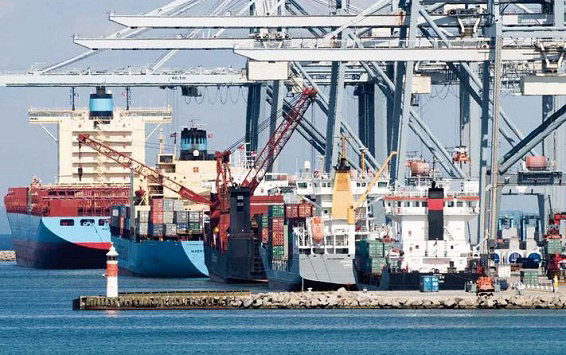
The New Normal in Global Trade and Container Shipping: Sailing in Strong Winds
In particular, we noted the persistent overcapacity that had been eroding shareholder returns despite reasonably high volume growth. We also proposed a way in which container carriers could make the transformations necessary to succeed in an increasingly volatile and complex environment.
Our analysis of developments that unfolded in 2015 affirms that the industry still faces daunting challenges. Until then, global volume growth of containers shipped worldwide had been decent: from 2010 through 2014, 4.5\% annually. It was overcapacity that presented the primary threat to shareholder returns. In 2015, for the first time, the industry faced weak demand, surprising all observers.
For this report, our aim was to understand whether this trend will prove cyclical or become a new normal. We conducted in-depth analyses of demand-side developments during 2015, reviewing those that affect major global trade routes, or trades, and key drivers of container demand. To gauge whether the trends we’re seeing will prove temporary or permanent, we considered how demand drivers could change in the next several years. Finally, we assessed moves that carriers, or container liners, can explore to defend their competitive position and further sharpen their edge.
One thing is clear: in this seascape, container-shipping companies that can continue to drive change stand the best chance of steaming ahead of their less progressive peers.
By the end of 2014, container demand showed signs of picking up, demonstrating average year-on-year global growth of 3.3\% compared with 2013. Several individual trade regions—particularly Asia-Europe (including Intra-Europe), Transpacific, and Indian subcontinent and Middle East—achieved impressive growth rates that year, even as Intra-Asia (historically a powerful growth engine) saw disappointing rates. The robust overall growth in 2014 excited the imaginations of carriers and analysts alike, raising their expectations for 2015 and beyond.
But then reality hit—and hit hard. By the end of 2015, annual global growth in the container-shipping trade was just 1.9\%. (See Exhibit 1.) The disappointing outcome stemmed largely from a disastrous year for the Asia-Europe trade, combined with the failure of more promising trades to achieve brisk-enough growth to offset other trades’ losses. Asia-Europe registered a dismal decline of 2.6\%. Growth for the Indian subcontinent and Middle East—while a relatively impressive 5.1\%—wasn’t enough to compensate. Intra-Asia saw 2.4\% growth, boosted by brisk trade throughout Southeast Asia, and Transpacific registered 3.5\% growth. But again, these gains weren’t enough to compensate for the big losses. Latin America, for its part, saw a 0.9\% drop, while Africa remained flat at 0.1\%.

In the last quarter of 2015 alone, global container trade sank by 5.4\%, with all trades suffering a drop—even those that had enjoyed increases earlier in the year. (See Exhibit 2.) Meanwhile, backhaul, driven mainly by reduced demand in industrial imports to China, dragged down most trades, registering a 0.4\% drop during 2015.

As demand lost momentum, the global fleet nevertheless expanded, with liners rushing to add 62 new ships above 10,000 20-foot-equivalent units (TEUs) in a bid to boost scale and reduce slot costs. The fleet growth rate peaked from 2014 through 2015 at 8.6\%, a significant jump over the 6.3\% seen from 2013 through 2014. This growth only worsened the overcapacity already afflicting the market, pulling freight rates down to new lows. Indeed, the Shanghai Containerized Freight Index tumbled from 1,000 at the beginning of 2015 to below 700 by year-end.
In 2015, for the first time in history, container demand growth lagged behind global gross domestic product growth, producing a GDP multiplier of less than 1. (See Exhibit 3.) This development raised questions: Was 2015 merely an anomaly, or was it a manifestation of a troubling new normal that’s here to stay? Will the GDP multiplier be the most useful KPI for tracking? Although it’s a well-known metric, it is a backward-looking multiplier, measuring only what has already happened. To make savvier decisions, shipping companies need to consider more forward-looking trends that illuminate developments in trade volumes. Later in this report, we examine 15 such trends in greater detail and consider their implications for specific trades.

A Closer Look at the Trades
What do these developments imply? For the major trades, how will container demand evolve through 2020? To explore possible answers, we analyzed the performance of key trades that collectively represent more than 80\% of total container trade worldwide: Asia-Europe, Transpacific, Intra-Asia, Indian subcontinent and Middle East, Latin America, and Africa. Because trade is fundamentally demand driven, we looked at developments in the forces that affect demand, such as industrial and consumer demand, as well as other forces that affect trade, including currency and structural changes in major economies. For each trend, we assessed whether the trend is temporary or a symptom of more enduring change.
Asia-Europe: Shrinking Imports
This trade saw imports from Asia into Northern Europe shrink by 3\% from 2014 through 2015. (See Exhibit 4.) The contraction was triggered by a number of forces. Russia accounted for more than 50\% of the volume loss, suffering a recession that was provoked by the sharp drop in oil prices and EU and US trade embargoes. Russian GDP growth fell from 0.4\% in 2014 to –3.7\% in 2015, and by the end of 2016, GDP growth will likely have dropped an additional 1.2\%. What’s more, the Russian ruble declined against other currencies, eroding Russia’s purchasing power and thus its ability to import goods. Consequently, imports contracted, diminishing container demand for all commodities.

Sluggish European industrial demand in the EU’s Big Three—Germany, France, and the UK—accounted for 6\% of the drop in import volume from Asia into Northern Europe.
Industrial export volumes from Europe to China also decreased. European manufacturing output is driven by overseas reexports, primarily to the US and China. With the slowdown in China’s economy and its government’s aggressive campaign for economic self-reliance, growth in European industrial-export volumes to China dropped from 15\% from 2005 through 2011 to just 2\% from 2011 through 2015. Over the next several years, European industrial reexports will likely show only modest growth, as the impact of China’s economic slump eclipses brisker growth of reexports to the US. In-deed, US industrial imports from Europe would have to increase at a CAGR of 11\% from 2015 through 2020 to offset the China effect.
In addition to the decline in industrial demand, the Big Three saw consumer spending contract. This was prompted by the region’s difficult economic recovery and consumers’ resulting pessimism—even as governments tried to stimulate spending by decreasing interest rates. European imports from Asia of retail goods—including toys, appliances, tires, leather goods, and apparel—fell from 2014 through 2015. Shipping companies blamed European retailers for reducing inventory stocks in response to weak consumer demand. But a number of indexes, as well as data from big retailers and consumer goods companies, show that inventories and procurement activity actually grew during 2015. Thus, the import slump cannot be attributed to destocking.
On a more positive note, the Central and Eastern European economies fared better than Russia and the Big Three in terms of industrial and consumer goods imports. From 2014 through 2015, these countries’ imports remained steady. Poland, in particular, shows potential for robust growth in domestic and transshipped cargo. Local economic growth in the countries of Central and Eastern Europe is being boosted by industrial output and consumer demand, as well as by their sound infrastructure, which enhances accessibility. A number of new services have recently been launched in Poland by liners seeking to capitalize on the opportunities there.
Still, taken together, all of these trends suggest that through 2020, Northern European imports from Asia won’t likely enjoy the strong growth rates of the past. The Russian economy will probably rebound during that period, as the effects of external shocks fade. But chances are small that European industrial demand will recover to precrisis growth levels. And any rebound in European household demand will still be tied to the restoration of consumer confidence.
Of course, uncertainty associated with Brexit, Britain’s historic vote to exit the EU, could constrain imports into the UK and affect other European countries. After the referendum, the International Monetary Fund acknowledged such a possible impact by revising downward the UK’s 2017 outlook on GDP growth from 2.2\% to 1.3\%, the biggest reduction among advanced economies. Across Europe, Brexit will likely have ripple effects on trade if political turmoil and uncertainty over Europe’s cohesiveness, further exacerbated by security concerns, put the brakes on capital investment and consumer spending.
Transpacific: Imminent Slowdown
Transpacific routes account for more than 60\% of total US imports, which have been experiencing decent growth. In this trade, US imports achieved 8\% year-on-year growth from 2014 through 2015, thanks mostly to significant increases in imports of consumer goods. In the US, per capita personal disposable income rose 2.3\% from 2013 through 2015, and consumer sentiment proved sunny too. The result was growth in aggregate consumption and a corresponding jump in imports of consumer goods from Asia.
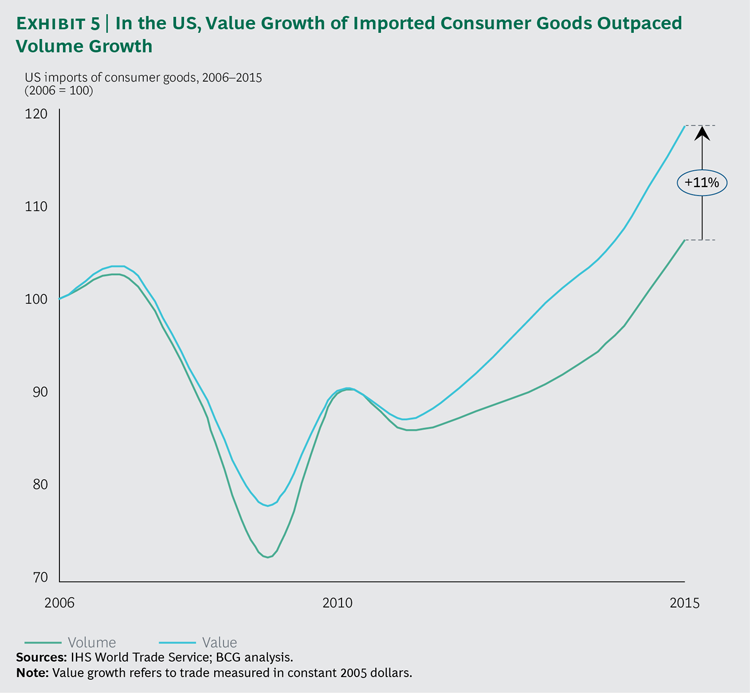
But we question whether this momentum can endure. For one thing, the economic rebound in the US is unevenly distributed, with the lion’s share of increased disposable income going to higher-income consumers. According to the American Economic Association, as their wealth expands, affluent families spend more on education and domestic services than on consumer goods. Thus, it’s important to distinguish between value growth and volume growth of imported consumer goods. (See Exhibit 5.) Meanwhile, families in the lower income brackets are exhibiting a savings mindset, choosing to salt away any pay increases they get rather than stepping up their spending on consumer goods. And baby boomers are retiring, while millennials are opting to spend more on experiences than on goods.
In the meantime, for some years now, rising manufacturing labor costs in China and other erstwhile low-cost countries have prompted many US companies to think about reshoring their manufacturing work. If this trend continues, we expect that Transpacific imports into the US will slow down in the coming years. However, collapsing energy prices and volatile foreign-exchange rates could delay this effect. In a BCG survey conducted in 2015, participating executives said that they believe that the US will account for a slightly lower portion of their companies’ global production capacity than they had indicated in 2014. (See The Shifting Economics of Global Manufacturing: How Cost Competitiveness Is Changing Worldwide, BCG report, August 2014, and “Reshoring of Manufacturing to the US Gains Momentum,” BCG article, December 2015.) Indeed, findings from BCG’s manufacturing survey show that appetite for reshoring has stagnated over the past two years.
Intra-Asia: The China Effect
Since 2010, this trade has enjoyed faster growth than several other key routes. Overall, the growth has been driven primarily by developments in China. With the maturation of the Chinese economy, several forces have exerted a complex but overall dampening effect on growth on Intra-Asia trade. As a result, trade volume has lost some momentum since 2012, downshifting from 11\% annual growth from 2010 through 2012 to just 2\% from 2012 through 2015.
No longer on a sky-high growth trajectory and experiencing a natural deceleration, China has also slowed its import and export of industrial goods. The structural transitions taking place in the economy—including greater reliance on domestic industry and a shift to consumption- and service-led growth and higher-value-adding goods—have further moderated trade growth. One development, the concentration of the entire supply chain within China, has had a key role in reducing Intra-Asia trade volumes. For instance, in the past, Chinese automotive companies had engine-manufacturing plants in Thailand and shipped the engines from there to China for automotive assembly in China’s domestic market. Now, the engine factories are located in China itself.
Furthermore, as the country’s minimum wage rises, China is offshoring low-value-adding industries (such as apparel manufacturing) to countries such as Vietnam. (See Exhibit 6.) This structural shift has provided a boost to trade in consumer goods. Additionally, Chinese consumers’ confidence levels remain healthy, even as their trading-up intentions have stalled. As of mid-2016, consumption patterns in China were holding up despite slowdowns and volatility in other areas. If these trends continue, we expect to see increased back-and-forth trade in finished consumer goods (such as food, footwear, and textiles) between China and Southeast Asia.

Meanwhile, Vietnam is becoming the fastest-growing exporter of finished goods in Southeast Asia, thanks to energetic investment in its infrastructure. This has driven up imports of industrial goods. What’s more, Asian countries dominate as sources of the inbound foreign direct investment supporting Vietnam’s industrialization, further fueling the growth of Intra-Asia trade.
As for Indonesia, because of currency depreciation and tariffs that hamstrung imports in 2015, the nation’s otherwise solid trade has proved disappointing. Nevertheless, we expect its large emerging middle class to recharge import trade in the future, providing a long-term boost to Intra-Asia. (See Consumer Durables: Capitalizing on a Growing Population of Shoppers, BCG Focus, December 2015.)
Looking at the Intra-China trade, which represents a significant portion of total Intra-Asia trade, we estimate that volume may have reached roughly 17 million TEUs in 2015. Strict cabotage rules make it difficult for international players to penetrate the Intra-China market, and the lack of robust and complete port data make it a “black box” for outsiders to analyze.
As for this trade’s outlook, improvements in availability and the quality of labor and transportation infrastructure in inland China have prompted many Chinese businesses to shift manufacturing for local consumption and export from coastal areas to the interior. There, shipping by truck currently dominates. Moreover, improved rail shipping will likely take a large share of inland transport, possibly reducing the available business for container liners across China’s coastal and river ports.
Indian Subcontinent and Middle East: A Rosy Outlook
This trade saw 6\% head haul and intra-region growth from 2014 through 2015. Saudi Arabia, India, and the United Arab Emirates led growth in this trade, accounting for as much as 76\% of the total year-on-year increase in importing. (See Exhibit 7.) The future of the trade looks positive overall.

Saudi Arabia’s continued dependency on oil, as well as an expected slowdown in GDP growth, will likely lead to a contraction in importing. Port traffic data already indicates that growth in imports slowed since container port throughput in Jeddah fell in 2015. The UAE’s Dubai saw a 2.6\% increase in container port throughput over the same time frame. And Iran made its debut by registering a 10.6\% jump, likely from the elimination of sanctions.
Developments in Iran and the UAE could help offset the impact on trade growth in Saudi Arabia. Indeed, Iran will play a pivotal role in the future: the nuclear deal with the US and other nations and the lifting of sanctions will boost the country’s trade volumes, enhancing imports and trade growth in this trade overall.
Meanwhile, imports into the UAE grew during 2015 and made a strong start in 2016 despite low oil prices. Even though falling prices affected the UAE’s GDP, the government has strived to diversify the economy by investing in sectors such as hospitality, manufacturing, real estate, construction, and financial services. The effort seems to have paid dividends for trade, especially industrial imports.
India, for its part, saw imports increase by 7\%, owing to strong demand for industrial goods that was driven by growth in capital expenditure, for example, for the construction of new factories. Industrial importing added more than 100,000 TEUs to container demand in 2015. That’s more than twice the amount added by consumer imports and significantly more than the amount added by industrial and consumer exporting. Indeed, we believe that India has considerable latent potential and is limited only by how well its infrastructure can support its trade needs.
India’s containerization rate is still low compared with the global average (in 2015, 25\% versus the 60\% to 70\% global average), and its port infrastructure is commonly viewed as suboptimal. But if the country can overcome these issues, it could see its port capacity climb by as much as 50\%. Such an increase would lift trade traffic growth through 2020.
Latin America and Africa: Great Expectations Not Yet Realized
These two trades experienced a slowdown in 2015: both saw trade volume growth flatten. Together, the two regions accounted for as much as 10\% of global trade in 2015, but they contributed only 2\% of the addition to global volume growth that year.
In Latin America, Brazil’s recession led to a 4\% contraction in GDP in 2015. Impacts included currency deflation and plummeting business and consumer confidence, which dragged down trade growth in the region overall. Latin America will likely continue to feel the effects of economic events in Brazil. But we also expect to see a countereffect from the steady increases in import and export CAGRs that Colombia, Peru, and Chile enjoyed from 2010 through 2015. Colombia’s gains were the most impressive: import and export CAGRs of 8\% and 5\%, respectively.
In Africa, trade growth stumbled after a currency depreciation—catalyzed by plunging oil and commodity prices—struck the key markets of Nigeria and Angola, the region’s two largest oil producers. The result was a sharp decrease in imports in these key markets, leading to stagnation in trade growth throughout Africa. In addition, as China slowed exports, it imported fewer raw materials from African countries, further affecting volumes in this trade.
Still, we believe that trade growth in the region will revive, thanks to rising urbanization and income levels as well as reforms that, together, will open up markets. GDP growth throughout Africa proved relatively impressive from 2000 through 2015, and overall trade hasn’t experienced a contraction during that time frame. Thus, we expect to see trade grow through 2020.
Container Supply-and-Demand Balance
In 2015, the gap between container supply and demand stood at 7\%. BCG projects a CAGR of 3.7\% for cellular fleet tonnage (including order book, scrapping, slippage, and cancellations) from 2016 through 2020, down from the 6.6\% seen from 2012 through 2015. (See Exhibit 11). Using BCG’s proprietary supply-and-demand model, we forecast a supply-demand gap in 2020 ranging from 8.2\% to 13.8\%. (See Exhibit 12.)


Base Scenario. The base scenario assumes a supply-demand gap of 9.4\% in 2020. This scenario hypothesizes a restrained improvement in container demand, with net capacity increasing at a steady and controlled pace. New orders would be driven by falling shipbuilding prices and favorable financing conditions. We expect slow-steaming practices to persist, while scrapping and idling capacity would follow recent historical averages.
Bear Scenario. The bear scenario’s 13.8\% gap would be driven by weak container demand, and industry players’ continued moderate capacity additions. Such additions are made with an eye to upgrading the fleet by taking advantage of lower capital costs and capturing operational efficiencies of new assets to drive down unit costs even more. We assume that liners will maintain their current slow-steaming practices.
Bull Scenario. The bull scenario’s 8.2\% gap rests on the assumption that container demand will rebound and carriers will speed up marginally by 1 to 2 knots. The aim of increased speed will be to take advantage of a prolonged period of low fuel prices and efficient assets, and it will be possible to release some of the capacity absorbed as a result of the current level of slow steaming.
The Supply-Demand Gap. By the end of 2020, oversupply in vessel capacity will stand at 2 million to 3.3 million TEUs—equivalent to some 90 to 150 or more Triple E class ultra-large container vessels. The year 2016 seems ready to set a new record for a reduction in capacity: seven months of scrapping (January through July) affected roughly 300,000 TEUs, and the age of vessels at their scrapping—20 years—dropped to a two-decade low. However, it’s uncertain how much more reduction is to come. Industry players are in a race for lower slot costs to ensure competitive advantage. The bigger, newer, and more efficient the vessel, the lower the slot cost, which is why companies want to invest in larger vessels.
More broadly, liners are part of an ecosystem: no single company can by itself exert full influence on that ecosystem, which includes shipyards, ship-financing banks, and the local and state governments that have interests at stake. For example, shipyards represent high political stakes in Japan, South Korea, and China, where they employ thousands of workers. And ship financing is linked tightly to state-related financial institutions. Liners can get favorable financing for vessels, because the need to keep a shipyard active can extend beyond any economic rationale and is a political imperative. Only if the ecosystem addresses the situation collectively can there be a possibility of containing fleet expansion.
The supply-and-demand fundamentals of this industry appear to indicate the emergence of a new normal. Before 2015, the industry’s major challenge was overcapacity. During 2015, demand proved weak, and trend analysis suggests that this lower demand will characterize the industry. In today’s challenging environment, carriers have to do even more to survive, never mind thrive. We believe they will need to craft increasingly sophisticated battle plans that enable them to further improve their own performance, so they can successfully “sail in strong winds.”
Crafting a Battle Plan
Our examination of the performance of shipping companies globally revealed only two viable paths: becoming a scale leader or becoming a niche player focused on certain trades. Companies that haven’t adopted either of these approaches appear to be stuck in the middle. They lack sufficient scale to drive down costs and the differentiation that can offer unique commercial value or command premium rates. (See Exhibit 13.)

This is a dangerous position in an increasingly commoditized industry. The number of alliances has grown, and offerings are becoming more and more similar on numerous fronts, such as schedule reliability and the provision of direct service. And thanks to more advanced technology platforms, customers now have more options and can shop around, further contributing to commoditization in the industry. Additionally, freight forwarders are gaining market share and capturing more direct customer relationships, especially profitable midsize clients.
On the basis of our work with clients, we believe that container liners can improve their performance under these harsh conditions by making the following moves:
– Driving Further M&A and Unlocking Synergies. Liners can boost their scale on their own (rather than by joining an alliance) by using a blend of global mergers and smaller M&A deals that can help drive down costs. Beyond the increase in scale that a merger brings, it can also unlock synergies, which will prove critical. Companies must harvest synergies by being savvier in their deployment of their fleet and network coverage. They also need to reassess their terminal and intermodal contracts and adjust their commercial networks in view of new market dynamics. For instance, carriers will want to increase their presence in specific locations where further growth opportunities do exist. In addition, they might consider streamlining their commercial networks where demand has decreased and will remain low. Developing an efficient platform of shared-service centers will also prove crucial for improving the productivity and service quality of an ever-larger range of services. And eventually, globalizing the flow of empty containers will help cut repositioning costs from surplus to deficit markets.
However, to capture the full potential of synergies from M&A deals, companies need to move quickly to a common IT infrastructure and shared processes. Our client work suggests that maximizing synergies through such means could decrease the cost base of a combined company by 5\% to 10\%.
– Pushing Alliances to the Next Level. Even companies that have not engaged in M&A deals will have to unlock more synergies from their alliances. Carriers have been shy about going after the full benefits alliances offer, such as cost savings from joint procurement or joint operations. Today, with a low bunker cost, the slot-cost advantage of ultralarge vessels is weaker than it was in times of super-high bunker costs. Additionally, alliances that comprise many players are complex, especially in terms of operations, and they generate a degree of rigidity that can hinder optimization of networks and operations.
To attain further benefits from alliances, members should, for example, explore the possibilities afforded by forging joint procurement and joint operations, pooling equipment such as container boxes, and combining shared-service centers in critical regions. Our work with clients in this industry suggests that maximizing alliance synergies in these ways can lift EBIT by roughly 3\%.
Still, as we pointed out in our 2015 report on container shipping, capturing these gains will require sophisticated alliance models characterized by better integration of operations and assets. Conventional alliances and vessel-sharing agreements (which focus on optimizing slot costs and extending network reach) are no longer enough. Moreover, in a traditional alliance model, the cost of the additional complexity that’s created through collaboration with many alliance partners may offset potential benefits.
– Optimizing the Core Business. Companies need to rethink their product offering and network of services. Most companies have grown their service offerings aggressively over the past ten years by, for example, adding more departures and calling at additional ports. A new chessboard of alliances and M&A characterize the industry today, so it’s time to assess the economic rationale for the services network. In particular, carriers need to challenge the setup of their network of services and optimize their fleet deployment. These moves can be tricky, given the nature of today’s alliances, which involve many players and leave limited room for maneuvering. At the same time, controlling costs remains table stakes for staying competitive. Our experience with clients indicates that such moves can deliver EBIT improvements of 5\% to 7\%.
– Enhancing Commercial Excellence. Even in an industry that has grown increasingly commoditized, players can create a competitive advantage by excelling on the commercial front in areas such as yield, sales force effectiveness, and channel strategy. In particular, they can take advantage of new technologies. For example, the powerful commercial platforms developed by freight forwarders indicate that market share can be grabbed, especially in the more profitable segments comprising midsize customers. Our experience with clients indicates that such moves can deliver EBIT improvements of 3\% to 5\%.
– Extracting Value from Adjacent Markets by Maximizing Share of Wallet. Companies should consider accelerating the development of more forwarding services, possibly in rapidly developing economies where logistics “corridors” (door-to-door logistics services) are nascent and supply chains are still fragmented. Countries and regions such as the Indian subcontinent, the Middle East, Africa, and Latin America are apt examples. Additional adjacency strategies include offering new logistics concepts (such as warehousing hubs) that use depot networks. The results of our work with clients suggest that adjacency strategies could deliver improvements of 4\% to 6\% in carriers’ returns on assets.
– Digitizing the Business. Companies can use digital technologies to improve the effectiveness and efficiency of their commercial platforms and booking systems. Such technologies would also help them boost the efficiency of internal processes and better manage the fleet. Examples include on-board technology that supports system monitoring and data exchange between ships and shore. In addition, smart use of technology can position the various players in the value chain (liners, terminals, intermodal players, customers) to communicate and collaborate more easily and successfully.
BCG analysis of volume growth in key global trades during 2015—along with assessments of important drivers of container demand—affirms that the global container-shipping industry is entering a new-normal period characterized by daunting challenges. These include persistent overcapacity, as well as overall sluggish growth in trade volumes stemming from a complex confluence of forces across key trades worldwide. To succeed in these challenging conditions, each player needs to keep driving change aimed at buttressing its individual performance. It will not be easy to meet these imperatives, but carriers that embrace the effort now stand the best chance of weathering the difficult times to come.
Source: Boston Consulting Group
Ocean Alliance unveils long-awaited 2017 service network
The information comes just days after the huge vessel sharing agreement received the green light from US maritime regulators to take sail on US trades when the alliance begins operations on April 1.
Approval has also been received from South Korea’s Ministry of Oceans and Fisheries and the alliance says its services are compliant with EU competition rules following a self-assessment compliance review. The master agreement of the Ocean Alliance is currently with China’s Ministry of Transport.
Members of the Ocean Alliance signed a document entitled the Day One Product, which sets out the proposed network, including port rotation for each service loop. The Day One network intends to deploy around 350 container vessels with an estimated total carrying capacity of 3.5 million teu to provide one of the most comprehensive service coverage in the market on the following trade lanes.
In a statement, the member lines said vessel deployment details for each service loop would be released around end of November. This is information that shippers have been urgently seeking, especially on the Asia-Europe trade, as they begin negotiating annual service contracts. THE Alliance is the second giant vessel sharing agreement that will start operations on April 1.
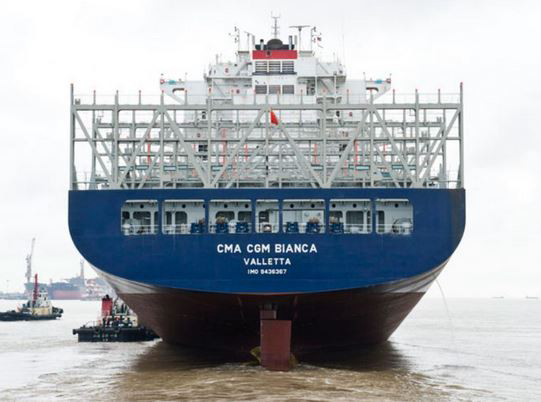
Rodolphe Saadé, vice chairman of the CMA CGM Group, said the Ocean Alliance was the largest operational agreement ever made between shipping companies. “By offering more ports and more direct calls, as well as better transit times, we will provide our customers with unmatched quality services,” he said.
As the vessel sharing agreement’s main contributor, CMA CGM will deploy a fleet of 119 vessels with a 35\% capacity share. The four partners will share their capacity on several routes using almost 350 vessels of about 3.5 million teu in total capacity.
Ocean Alliance would have the dominant capacity position on the two largest trades, with a nearly 35 percent share of the Asia-North America trade, and a roughly 39 percent share of the Asia-Europe trade, according to shipping analyst Alphaliner.
The trans-Pacific market will see the largest coverage by the Ocean Alliance with 20 loops, 145 weekly calls and 52 ports. In a statement issued via CMA CGM, the alliance said its trans-Pacific services would offer “the most comprehensive market coverage and geographic consistency by loop for optimized transit times to main markets.” Vessel deployment details for each service loop will be released at the end of November.
http://fairplay.ihs.com/
Bunker, shipping industry welcomes IMO’s mandatory marine fuel data regulation
The new regulation 22A on collection and reporting of ship fuel oil consumption data and new appendices, was adopted by IMO’s Marine Environment Protection Committee on October 28 as amendments to chapter 4 of annex VI of MARPOL.
It requires ships above 5,000 gross tonnage to start collecting and reporting data to an IMO Ship Fuel Oil Consumption Database from the start of 2019, the International Bunker Industry Association (IBIA) said on its website.
“These amendments are expected to enter into force on 1 March 2018, under the tacit acceptance procedure,” it added.
Under this regulation, ships will have to collect consumption data for each type of fuel oil they use, and additional, specified data including proxies for transport work according to a methodology set out in the Ship Energy Efficiency Management Plan (SEEMP), the IBIA said.
The purpose of 22A is to obtain a more accurate picture of the contribution of shipping to global carbon emissions as part of a three-step approach, starting with data collection, followed by data analysis, and finally policy decisions.
It will help determine the need for further measures to enhance energy efficiency and address greenhouse gas emissions from international shipping, the IBIA said.
Aggregated data will be reported to a ship’s flag State after the end of each calendar year. The flag State will in turn need to verify the data has been reported in accordance with the requirements before issuing a Statement of Compliance to the ship.
It will be required to subsequently transfer this data to the IMO’s database, it added.
“The adoption of the Road Map is a significant decision by IMO Member States that will give further impetus to the substantial CO2 reductions that are already being delivered by technical and operational measures, and the binding global CO2 reduction regulations for shipping adopted by IMO in 2011, four years before the Paris Agreement,” Peter Hinchliffe International Chamber of Shipping Secretary General said on its website.
The MEPC agreement last week on a mandatory global CO2 data collection system is significant as the IMO data system will inform the development of a mechanism by IMO for ensuring that the CO2 reduction commitments are met, ICS said. ICS membership comprises national shipowners’ associations in Asia, Europe and the Americas whose member shipping companies operate over 80\% of the world’s merchant tonnage.
Separately, the Sustainable Shipping Initiative (SSI), an independent charity which includes charterers and ship owners, ship yards, class societies and technology companies, has also welcomed the move to develop a more definitive strategy to reduce greenhouse gas emissions (GHG). “The development of a GHG emissions reduction roadmap to 2023, and the adoption of an initial strategy with short, medium and long-term measures in 2018 is a positive step forwards for the shipping industry,” said Ian Petty, General Manager, SSI in a statement.
“However, significant work still needs to be conducted to maintain momentum and enable the industry to agree on the level of ambition for emissions reduction,” Petty said.
Source: Platts
Cyprus shipmanagement revenues decline 3\% in H1 2016

In the January - June period shipmanagement added EUR438m ($483m) to Cypriot coffers down from EUR462m in such revenues in the second half of 2015 and a record EUR64m in the first half of 2015, the country’s central bank said in a mid-year report.
The latest result reflects the ongoing slump in shipping markets as the boost received 12 months ago primarily came from Greece as a result of tax uncertainty and the country’s domestic economic crisis.
Cyprus is one of Europe’s most significant management hubs and despite the drop, shipmanagement revenues still account for over 5\% of the country's economic output.
Payments out of Germany remained by far the biggest source of ship-management revenue for the island, accounting for 38\% of the total down from 41\% in the second half of 2015. Greece’s share, which had reached 8\% at the end of last year has declined to 6\% as the initial concern over the European Union's moves against Greece's shipping tax legislation abated.
The decline on the part of Greece-based owners put them on a par with Switzerland and Singapore as Cyprus’ second-biggest clients. Russia and Malta come next, each with a 4\% market share.
© Copyright 2016 Seatrade (UBM (UK) Ltd).
David Glass
Greece Correspondent, Seatrade Maritime
LNG shipping under threat from cargo diversions
Drewry has been maintaining a bullish long-term outlook for LNG shipping for quite some time and expects rates to improve substantially from 2018 onwards. One of the major reasons for this outlook is the expansion in US LNG supply.

Since most new LNG export capacity in the US will start to come online from 2018 onwards and almost 85-90\% of this supply has been tied to contracts, the trade will create demand for a large number of vessels. However, the LNG market has changed considerably from the time when these contracts were signed and so Asian buyers are looking to offload their contractual supply. If we continue to see more Asian LNG buyers looking to divert their US cargoes either to Europe or Latin America, this could substantially reduce the demand for LNG ships, taking into account the shorter hauls from the US to Europe or to Latin America.
“Although the capacity diverted so far by Asian buyers is not significant enough to negatively impact LNG shipping, if this trend continues and more Asian buyers follow suit, it will reduce demand for LNG vessels”, said Shresth Sharma, Drewry’s lead LNG shipping analyst.
Drewry analysed three scenarios (see graph) based on the 53 mtpa of capacity currently being built in the US. Hence, if 60\% of this capacity reached Asian markets while 30\% and 10\% respectively goes to Europe and Latin America, 85 vessels would be required to carry the tonnage from the US. However, if Asian buyers continue to divert their contracted supply and only 30\% reaches Asia, while 40\% and 30\% goes to Europe and Latin America respectively, a demand for only 68 vessels would be created.
Source: Drewry Shipping Consultants
HMM Acquires Hanjin's 11 Ships
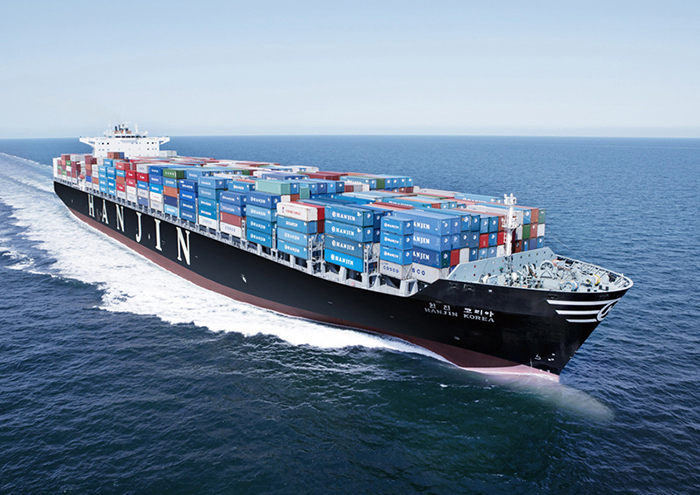
Haeyoung Maritime Services Co., a subsidiary of HMM which provides ship management and maintenance services, has managed one container and three bulk carriers returned by Hanjin Shipping to the KDB at the end of last month.
These are Hanjin Shipping’s vessels on bareboat charter hire purchase (BBCHP). The financially ailing company returned them to the KDB as it can no longer afford to make the remaining loan repayments to the bank.
Hanjin Shipping has a total of 11 ships – two containers and nine bulk carriers – on the BBCHP financed by the KDB.
Once HMM takes over and operates all 11 vessels, the number of its ships will increase from 119 – 63 containers and 56 bulk carriers – to 130 – 65 containers and 65 bulk carriers.
http://www.marinelink.com/
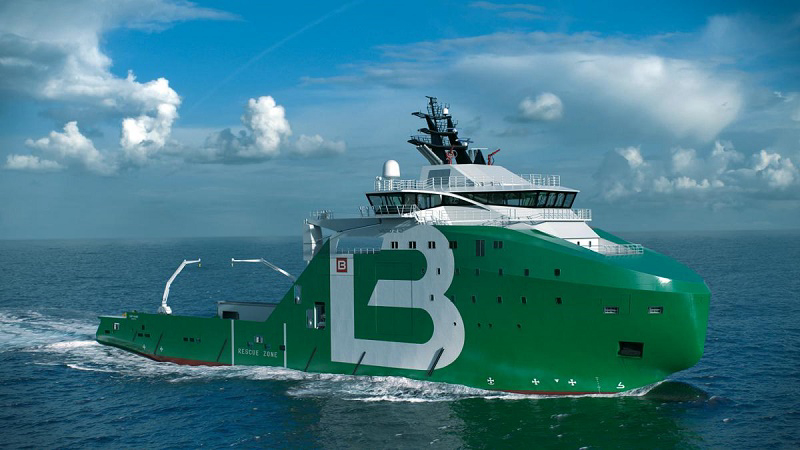
Bourbon Offshore stacks another 14 vessels
 |
Bourbon now has 85 vessels stacked, made up of 59 shallow water offshore vessels, 22 deepwater offshore vessels and 6 subsea vessels. The biggest loser was in the shallow water segment which saw 13 vessels stacked during the quarter. The company said the market in this segment deteriorated severely during the quarter.
Positively, two subsea vessels were brought out of stacking during the quarter.
Despite the rush of vessels into layup Jacques de Chateauvieux, chairman and CEO of Bourbon remained positive, commenting: “The expectations of a potential rebalancing of oil supply and demand in 2017 on account of the sharp drop in investment by oil companies, as well as the search for agreements between producer countries, may mark the start of a recovery in activity.”
De Chateauvieux added that cost control would remain a focus for the company.
Revenues for Bourbon for the quarter were €259.1m, down 24.7\% on last year.
http://splash247.com/
Seagull Maritime presents latest developments and training products & services at their annual User Meeting in Athens

 |
| Mr. Ioannis Athanasopoulos, Managing Director of Seagull Maritime Greece |
The attendees had the chance to discover opportunities from new Seagull software packages on E-learning, onboard training and assessment material, through interaction between speakers and participants.
Mr. Ioannis Athanasopoulos, Managing Director of Seagull Maritime Greece presented the speakers and gave the welcome address as well as a detailed update on Seagull’s latest developments in all aspects. Mr. Athanasopoulos stated that Seagull Maritime AS since its formation in 1996 has been delivering a full range of seafarer training, assessment and management tools to ensure that STCW requirements, IMO standards and industry requirements are met and exceeded on board vessels. It produces specialized E-learning software and Films used by well over 700 clients across the shipping industry, with more than 10000 vessels and office installations around the world. Seagull training services are supported by a network of offices worldwide with the headquarters in Norway and group branches in Germany, UK, Poland, Greece, Singapore , Japan and Hong Kong. Mr. Athanasopoulos pointed out that Seagull’s products are certified by DNV-GL, approved and accredited by flag states such as Norway, Bahamas, Cyprus and many others. Furthermore, after his welcome speech, he delivered presentation on the new Developments of the company. He referred to the company’s new released E-learning content and he presented new features of Seagull’s updated Administrative software (STA 4.0)
Capt. Evangelos Galanopoulos , Fleet Support Officer in S&Q Dept., “Eastern Mediterranean Maritime” based in Athens, presented the user’s view for the Seagull Training System and Crew Evaluation
 |
Capt. Szymanski, Secretary General of InterManager delivered a presentation related to Fatigue Management and Paperless Ship topics. He referred to the very important factor of Sleepiness and Fatigue of seafarers. He suggested Fatigue Risk Management through Fatigue Risk Management Systems and “goal based approach” in order to keep motivation of seafarers in high level. Moreover, he referred to the concept of “Paperless Ship” and the initiate to ease seafarer’s workload by reducing amount of administrative work and help them to be more focus on priority and essential jobs (www.intermanager.org)
Mr. Torger Tau, Senior instructor in Courses Department spoke about existing Onboard & Distance courses and future plans. Seagull provides onboard courses which have been approved by major Flag States as well as distance courses which lead to respective diplomas. Another important discussed topic is ECDIS equipment specific training. Seagull has signed agreements and developed CBT modules for ECDIS training in cooperation with MARIS & Consilium as well as JRC, Kelvin Hughes, Tokyo Keiki, SAM/Wartsila. Mr. Tau referred to recently released Onboard/Distance Courses like “Enclosed Space Entry”, “Fatigue Management”, “Navigation in Ice”. Lastly, he presented total numbers of issued Certificates in 2015 and 2016 which reflect how well accepted is subject concept by Shipping Companies worldwide.
At the last session, Mr. George Hoyt, IMO Maritime Ambassador, FNI, Vice President Projects InterManager presented Solutions that Shipping Companies can participate. Benchmarking through KPI System which can boost company’s performance, Training of seafarers as well as shore based personnel and other various good practices can be applied and help Shipping Industry to face current challenges. Moreover, he introduced “Mona Lisa” project, a program co-financed by EU through which we will be able to have real time information for the whole transport chain. This will change maritime world, as he underlined. Lastly, he spoke about “Adopt a ship” Program, was initiated by the Cyprus Shipping Chamber in 2006 to bring together the Elementary Schools and Seafarers on board CSC Members ships in order to provide a real world learning experience for elementary school children.
 |
Dynagas Bags Charter Deals with Gazprom

The Clean Energy is the Partnership's only non-ice classed LNG Carrier. The charter is expected to commence in July 2018 and will have a firm duration of about 7 years and 9 months.
The gross contracted revenue from this contract is expected to be approximately $133 million over this period.
Following the expiration of the existing time charter to Shell in the second quarter of 2017, Clean Energy will undergo its statutory class five-year special survey and dry-docking and the Partnership will seek to employ it under shorter term employment until the commencement of the new Gazprom time charter.
In connection with the employment of Clean Energy, the Partnership has also agreed with Gazprom Global LNG Limited commencing November 1st 2016 to reduce the charter income on both the 2013 built Yenisei River and the Lena River.
Following this amendment, the contracted revenues for the Yenisei River and Lena River as of November 1st, 2016 will be reduced by approximately USD 8.7 million for the Yenisei and USD 9.6 million for the Lena River over their remaining current charter terms which expire earliest in July and September 2018 respectively.
Tony Lauritzen, Chief Executive Officer of the Partnership, commented: "We are pleased to report these new charter arrangements which result in an improved charter profile for the Partnership and increases the Partnership's contracted backlog as of November 1st, 2016 to approximately USD 1.6 billion from USD 1.5 billion prior to the conclusion of these new charter arrangements."
He added: "We have previously communicated that we focus on securing long term employment for our vessels and in particular for the Clean Energy, which is the only vessel in our fleet without ice class notation. We believe that employing this particular vessel as a conventional LNG Carrier as opposed to converting into an FSRU is a low risk and economical solution that benefits our unitholders."
The current fleet of Dynagas LNG Partners consists of six LNG carriers, each of which has a carrying capacity of approximately 150,000 to 155,000 cbm.
![]()
Powered by ![]() © Μaritimes 2019
© Μaritimes 2019